Wells Fargo 2013 Annual Report Download - page 61
Download and view the complete annual report
Please find page 61 of the 2013 Wells Fargo annual report below. You can navigate through the pages in the report by either clicking on the pages listed below, or by using the keyword search tool below to find specific information within the annual report.-
 1
1 -
2
-
3
-
4
-
5
-
6
-
7
-
8
-
9
-
10
-
11
-
12
-
13
-
14
-
15
-
16
-
17
-
18
-
19
-
20
-
21
-
22
-
23
-
24
-
25
-
26
-
27
-
28
-
29
-
30
-
31
-
32
-
33
-
34
-
35
-
36
-
37
-
38
-
39
-
40
-
41
-
42
-
43
-
44
-
45
-
46
-
47
-
48
-
49
-
50
-
 51
51 -
 52
52 -
 53
53 -
 54
54 -
 55
55 -
 56
56 -
 57
57 -
 58
58 -
 59
59 -
 60
60 -
 61
61 -
 62
62 -
 63
63 -
 64
64 -
 65
65 -
 66
66 -
 67
67 -
 68
68 -
 69
69 -
 70
70 -
 71
71 -
72
-
73
-
74
-
75
-
76
-
77
-
78
-
79
-
80
-
81
-
82
-
83
-
84
-
85
-
86
-
87
-
88
-
89
-
90
-
91
-
92
-
93
-
94
-
95
-
96
-
97
-
98
-
99
-
100
-
101
-
102
-
103
-
104
-
105
-
106
-
107
-
108
-
109
-
110
-
111
-
112
-
113
-
114
-
115
-
116
-
117
-
118
-
119
-
120
-
121
-
122
-
123
-
124
-
125
-
126
-
127
-
128
-
129
-
130
-
131
-
132
-
133
-
134
-
135
-
136
-
137
-
138
-
139
-
140
-
141
-
142
-
143
-
144
-
145
-
146
-
147
-
148
-
149
-
150
-
151
-
152
-
153
-
154
-
155
-
156
-
157
-
158
-
159
-
160
-
161
-
162
-
163
-
164
-
165
-
166
-
167
-
168
-
169
-
170
-
171
-
172
-
173
-
174
-
175
-
176
-
177
-
178
-
179
-
180
-
181
-
182
-
183
-
184
-
185
-
186
-
187
-
188
-
189
-
190
-
191
-
192
-
193
-
194
-
195
-
196
-
197
-
198
-
199
-
200
-
201
-
202
-
203
-
204
-
205
-
206
-
207
-
208
-
209
-
210
-
211
-
212
-
213
-
214
-
215
-
216
-
217
-
218
-
219
-
220
-
221
-
222
-
223
-
224
-
225
-
226
-
227
-
228
-
229
-
230
-
231
-
232
-
233
-
234
-
235
-
236
-
237
-
238
-
239
-
240
-
241
-
242
-
243
-
244
-
245
-
246
-
247
-
248
-
249
-
250
-
251
-
252
-
253
-
254
-
255
-
256
-
257
-
258
-
259
-
260
-
261
-
262
-
263
-
264
-
265
-
266
-
267
-
268
-
269
-
270
-
271
-
272
 |
 |

most current financial information available and is focused on
various key financial metrics, including net worth, leverage, and
current and future liquidity. We consider the guarantor’s
reputation, creditworthiness, and willingness to work with us
based on our analysis as well as other lenders’ experience with
the guarantor. Our assessment of the guarantor’s credit strength
is reflected in our loan risk ratings for such loans. The loan risk
rating and accruing status are important factors in our allowance
methodology.
In considering the accrual status of the loan, we evaluate the
collateral and future cash flows as well as the anticipated support
of any repayment guarantor. In many cases the strength of the
guarantor provides sufficient assurance that full repayment of
the loan is expected. When full and timely collection of the loan
becomes uncertain, including the performance of the guarantor,
we place the loan on nonaccrual status. As appropriate, we also
charge the loan down in accordance with our charge-off policies,
generally to the net realizable value of the collateral securing the
loan, if any.
At the time of any modification of terms or extensions of
maturity, we evaluate whether the loan should be classified as a
TDR, and account for it accordingly. For more information on
TDRs, see “Troubled Debt Restructurings” later in this section
and Note 6 (Loans and Allowance for Credit Losses) to Financial
Statements in this Report.
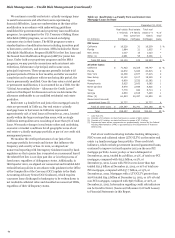
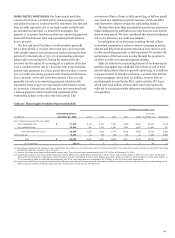
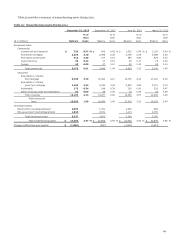
COMMERCIAL REAL ESTATE (CRE) The CRE portfolio totaled
$123.8 billion, or 15% of total loans at December 31, 2013, and
consisted of $107.1 billion of mortgage loans and $16.7 billion of
construction loans. Table 21 summarizes CRE loans by state and
property type with the related nonaccrual totals. The portfolio is
diversified both geographically and by property type. The largest
geographic concentrations of combined CRE loans are in
California (28% of the total CRE portfolio), and in Florida and
Texas (8% in each state). By property type, the largest
concentrations are office buildings at 28% and apartments at
13% of the portfolio. CRE nonaccrual loans totaled 2.2% of the
CRE outstanding balance at December 31, 2013, compared with
3.5% at December 31, 2012. At December 31, 2013, we had
$11.8 billion of criticized CRE mortgage loans, down from
$18.8 billion at December 31, 2012, and $2.0 billion of criticized
CRE construction loans, down from $4.5 billion at
December 31, 2012. See Note 6 (Loans and Allowance for Credit
Losses) to Financial Statements in this Report for additional
information on criticized loans.
At December 31, 2013, the recorded investment in PCI CRE
loans totaled $1.6 billion, down from $12.3 billion when
acquired at December 31, 2008, reflecting principal payments,
loan resolutions and write-downs.
Table 21: CRE Loans by State and Property Type
December 31, 2013
Real estate mortgage Real estate construction Total
(in millions)
Nonaccrual
loans
Total
portfolio (1)
Nonaccrual
loans
Total
portfolio (1)
Nonaccrual
loans
Total
portfolio (1)
% of
total
loans
By state:
California $ 536 30,854 50 3,550 586 34,404 4 %
Florida 303 8,971 49 1,426 352 10,397 1
Texas 166 8,598 23 1,673 189 10,271 1
New York 48 6,610 5 1,188 53 7,798 1
North Carolina 148 4,058 26 971 174 5,029 1
Arizona 104 3,992 7 422 111 4,414 1
Virginia 77 2,742 6 1,054 83 3,796 1
Washington 30 3,244 3 423 33 3,667 *
Georgia 153 3,026 45 453 198 3,479 *
Colorado 39 2,829 7 602 46 3,431 *
Other 648 32,176 195 4,985 843 37,161 (2) 5
Total $ 2,252 107,100 416 16,747 2,668 123,847 15 %
By property:
Office buildings $ 572 32,294 49 2,030 621 34,324 4 %
Apartments 139 10,606 3 4,883 142 15,489 2
Industrial/warehouse 367 12,038 - 732 367 12,770 2
Retail (excluding shopping center) 278 11,627 22 890 300 12,517 2
Real estate - other 272 10,709 5 335 277 11,044 1
Hotel/motel 93 8,919 10 792 103 9,711 1
Shopping center 184 8,042 9 880 193 8,922 1
Institutional 77 2,850 - 430 77 3,280 1
Land (excluding 1-4 family) 7 80 97 2,992 104 3,072 *
Agriculture 45 2,295 - 29 45 2,324 *
Other 218 7,640 221 2,754 439 10,394 1
Total $ 2,252 107,100 416 16,747 2,668 123,847 15 %
* Less than 1%.
(1) Includes a total of $1.6 billion PCI loans, consisting of $1.1 billion of real estate mortgage and $433 million of real estate construction, which are considered to be accruing
due to the existence of the accretable yield and not based on consideration given to contractual interest payments.
(2) Includes 40 states; no state had loans in excess of $2.8 billion.
59