Wells Fargo 2013 Annual Report Download - page 42
Download and view the complete annual report
Please find page 42 of the 2013 Wells Fargo annual report below. You can navigate through the pages in the report by either clicking on the pages listed below, or by using the keyword search tool below to find specific information within the annual report.-
 1
1 -
2
-
3
-
4
-
5
-
6
-
7
-
8
-
9
-
10
-
11
-
12
-
13
-
14
-
15
-
16
-
17
-
18
-
19
-
20
-
21
-
22
-
23
-
24
-
25
-
26
-
27
-
28
-
29
-
30
-
31
-
 32
32 -
 33
33 -
 34
34 -
 35
35 -
 36
36 -
 37
37 -
 38
38 -
 39
39 -
 40
40 -
 41
41 -
 42
42 -
 43
43 -
 44
44 -
 45
45 -
 46
46 -
 47
47 -
 48
48 -
 49
49 -
 50
50 -
 51
51 -
 52
52 -
53
-
54
-
55
-
56
-
57
-
58
-
59
-
60
-
61
-
62
-
63
-
64
-
65
-
66
-
67
-
68
-
69
-
70
-
71
-
72
-
73
-
74
-
75
-
76
-
77
-
78
-
79
-
80
-
81
-
82
-
83
-
84
-
85
-
86
-
87
-
88
-
89
-
90
-
91
-
92
-
93
-
94
-
95
-
96
-
97
-
98
-
99
-
100
-
101
-
102
-
103
-
104
-
105
-
106
-
107
-
108
-
109
-
110
-
111
-
112
-
113
-
114
-
115
-
116
-
117
-
118
-
119
-
120
-
121
-
122
-
123
-
124
-
125
-
126
-
127
-
128
-
129
-
130
-
131
-
132
-
133
-
134
-
135
-
136
-
137
-
138
-
139
-
140
-
141
-
142
-
143
-
144
-
145
-
146
-
147
-
148
-
149
-
150
-
151
-
152
-
153
-
154
-
155
-
156
-
157
-
158
-
159
-
160
-
161
-
162
-
163
-
164
-
165
-
166
-
167
-
168
-
169
-
170
-
171
-
172
-
173
-
174
-
175
-
176
-
177
-
178
-
179
-
180
-
181
-
182
-
183
-
184
-
185
-
186
-
187
-
188
-
189
-
190
-
191
-
192
-
193
-
194
-
195
-
196
-
197
-
198
-
199
-
200
-
201
-
202
-
203
-
204
-
205
-
206
-
207
-
208
-
209
-
210
-
211
-
212
-
213
-
214
-
215
-
216
-
217
-
218
-
219
-
220
-
221
-
222
-
223
-
224
-
225
-
226
-
227
-
228
-
229
-
230
-
231
-
232
-
233
-
234
-
235
-
236
-
237
-
238
-
239
-
240
-
241
-
242
-
243
-
244
-
245
-
246
-
247
-
248
-
249
-
250
-
251
-
252
-
253
-
254
-
255
-
256
-
257
-
258
-
259
-
260
-
261
-
262
-
263
-
264
-
265
-
266
-
267
-
268
-
269
-
270
-
271
-
272
 |
 |

Earnings Performance (continued)
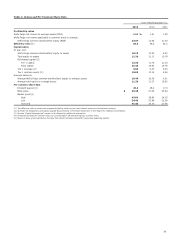
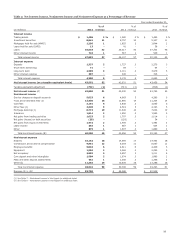
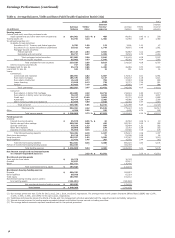
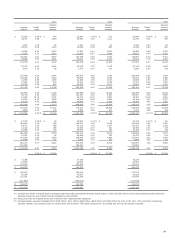
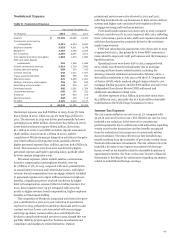
Table 6 allocates the changes in net interest income on a not possible to precisely allocate such changes between volume
taxable-equivalent basis to changes in either average balances or and rate. For this table, changes that are not solely due to either
average rates for both interest-earning assets and volume or rate are allocated to these categories on a pro-rata
interest-bearing liabilities. Because of the numerous basis based on the absolute value of the change due to average
simultaneous volume and rate changes during any period, it is volume and average rate.
Table 6: Analysis of Changes of Net Interest Income
Year ended December 31,
2013 over 2012 2012 over 2011
(in millions) Volume Rate Total Volume Rate Total
Increase (decrease) in interest income:
Federal funds sold, securities purchased under resale
agreements and other short-term investments $ 245 (134) 111 (12) 45 33
Trading assets 90 (64) 26 78 (161) (83)
Investment securities:
Available-for-sale securities:
Securities of U.S. Treasury and federal agencies 49 16 65 (25) 3 (22)
Securities of U.S. states and political subdivisions 223 (36) 187 499 (161) 338
Mortgage-backed securities:
Federal agencies 421 (283) 138 687 (1,051) (364)
Residential and commercial (185) (91) (276) 129 (482) (353)
Total mortgage-backed securities 236 (374) (138) 816 (1,533) (717)
Other debt and equity securities 217 (269) (52) 475 (424) 51
Total available-for-sale securities 725 (663) 62 1,765 (2,115) (350)
Held-to-maturity securities 22 - 22 - - -
Mortgages held for sale (502) (33) (535) 465 (284) 181
Loans held for sale (37) 9 (28) (26) 9 (17)
Loans:
Commercial:
Commercial and industrial 539 (713) (174) 680 (593) 87
Real estate mortgage 2 (266) (264) 133 115 248
Real estate construction (73) (37) (110) (182) 21 (161)
Lease financing (50) (133) (183) (13) (42) (55)
Foreign 84 (122) (38) 77 (34) 43
Total commercial 502 (1,271) (769) 695 (533) 162
Consumer:
Real estate 1-4 family first mortgage 848 (803) 45 367 (786) (419)
Real estate 1-4 family junior lien mortgage (452) 8 (444) (424) (45) (469)
Credit card 247 (49) 198 167 (76) 91
Automobile 254 (279) (25) 99 (264) (165)
Other revolving credit and installment (2) 98 96 (46) 61 15
Total consumer 895 (1,025) (130) 163 (1,110) (947)
Total loans 1,397 (2,296) (899) 858 (1,643) (785)
Other (4) 30 26 (21) 27 6
Total increase (decrease) in interest income 1,936 (3,151) (1,215) 3,107 (4,122) (1,015)
Increase (decrease) in interest expense:
Deposits:
Interest-bearing checking 3 - 3 (12) (9) (21)
Market rate and other savings 55 (197) (142) 65 (309) (244)
Savings certificates (123) (100) (223) (135) (78) (213)
Other time deposits 152 (183) (31) 5 (48) (43)
Deposits in foreign offices 11 (8) 3 13 (40) (27)
Total interest-bearing deposits 98 (488) (390) (64) (484) (548)
Short-term borrowings 6 (29) (23) - - -
Long-term debt 171 (696) (525) (362) (506) (868)
Other liabilities 61 1 62 (25) (46) (71)
Total increase (decrease) in interest expense 336 (1,212) (876) (451) (1,036) (1,487)
Increase (decrease) in net interest income
on a taxable-equivalent basis $ 1,600 (1,939) (339) 3,558 (3,086) 472
40