Wells Fargo 2013 Annual Report Download - page 206
Download and view the complete annual report
Please find page 206 of the 2013 Wells Fargo annual report below. You can navigate through the pages in the report by either clicking on the pages listed below, or by using the keyword search tool below to find specific information within the annual report.-
 1
1 -
2
-
3
-
4
-
5
-
6
-
7
-
8
-
9
-
10
-
11
-
12
-
13
-
14
-
15
-
16
-
17
-
18
-
19
-
20
-
21
-
22
-
23
-
24
-
25
-
26
-
27
-
28
-
29
-
30
-
31
-
32
-
33
-
34
-
35
-
36
-
37
-
38
-
39
-
40
-
41
-
42
-
43
-
44
-
45
-
46
-
47
-
48
-
49
-
50
-
51
-
52
-
53
-
54
-
55
-
56
-
57
-
58
-
59
-
60
-
61
-
62
-
63
-
64
-
65
-
66
-
67
-
68
-
69
-
70
-
71
-
72
-
73
-
74
-
75
-
76
-
77
-
78
-
79
-
80
-
81
-
82
-
83
-
84
-
85
-
86
-
87
-
88
-
89
-
90
-
91
-
92
-
93
-
94
-
95
-
96
-
97
-
98
-
99
-
100
-
101
-
102
-
103
-
104
-
105
-
106
-
107
-
108
-
109
-
110
-
111
-
112
-
113
-
114
-
115
-
116
-
117
-
118
-
119
-
120
-
121
-
122
-
123
-
124
-
125
-
126
-
127
-
128
-
129
-
130
-
131
-
132
-
133
-
134
-
135
-
136
-
137
-
138
-
139
-
140
-
141
-
142
-
143
-
144
-
145
-
146
-
147
-
148
-
149
-
150
-
151
-
152
-
153
-
154
-
155
-
156
-
157
-
158
-
159
-
160
-
161
-
162
-
163
-
164
-
165
-
166
-
167
-
168
-
169
-
170
-
171
-
172
-
173
-
174
-
175
-
176
-
177
-
178
-
179
-
180
-
181
-
182
-
183
-
184
-
185
-
186
-
187
-
188
-
189
-
190
-
191
-
192
-
193
-
194
-
195
-
 196
196 -
 197
197 -
 198
198 -
 199
199 -
 200
200 -
 201
201 -
 202
202 -
 203
203 -
 204
204 -
 205
205 -
 206
206 -
 207
207 -
 208
208 -
 209
209 -
 210
210 -
 211
211 -
 212
212 -
 213
213 -
 214
214 -
 215
215 -
 216
216 -
217
-
218
-
219
-
220
-
221
-
222
-
223
-
224
-
225
-
226
-
227
-
228
-
229
-
230
-
231
-
232
-
233
-
234
-
235
-
236
-
237
-
238
-
239
-
240
-
241
-
242
-
243
-
244
-
245
-
246
-
247
-
248
-
249
-
250
-
251
-
252
-
253
-
254
-
255
-
256
-
257
-
258
-
259
-
260
-
261
-
262
-
263
-
264
-
265
-
266
-
267
-
268
-
269
-
270
-
271
-
272
 |
 |

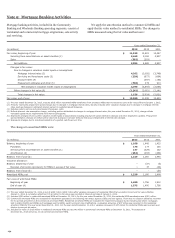
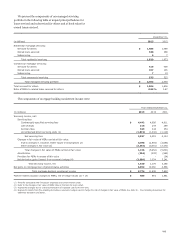
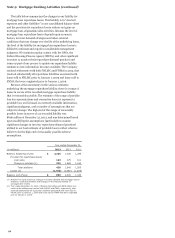
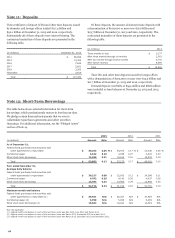
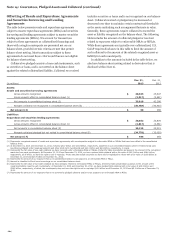
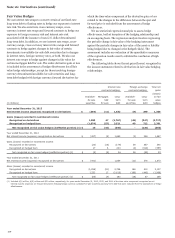
Note 14: Guarantees, Pledged Assets and Collateral (continued)
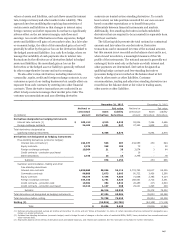
Offsetting of Resale and Repurchase Agreements
and Securities Borrowing and Lending
Agreements
The table below presents resale and repurchase agreements
subject to master repurchase agreements (MRA) and securities
borrowing and lending agreements subject to master securities
lending agreements (MSLA). We account for transactions
subject to these agreements as collateralized financings and
those with a single counterparty are presented net on our
balance sheet, provided certain criteria are met that permit
balance sheet netting. Most transactions subject to these
agreements do not meet those criteria and thus are not eligible
for balance sheet netting.
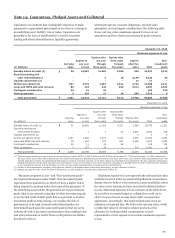
Collateral we pledged consists of non-cash instruments, such
as securities or loans, and is not netted on the balance sheet
against the related collateralized liability. Collateral we received
includes securities or loans and is not recognized on our balance
sheet. Collateral received or pledged may be increased or
decreased over time to maintain certain contractual thresholds
as the assets underlying each arrangement fluctuate in value.
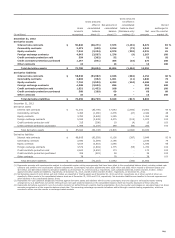
Generally, these agreements require collateral to exceed the
asset or liability recognized on the balance sheet. The following
table includes the amount of collateral pledged or received
related to exposures subject to enforceable MRAs or MSLAs.
While these agreements are typically over-collateralized, U.S.
GAAP requires disclosure in this table to limit the amount of
such collateral to the amount of the related recognized asset or
liability for each counterparty.
In addition to the amounts included in the table below, we
also have balance sheet netting related to derivatives that is
disclosed within Note 16.
$
$
$
(in millions)
Dec. 31,
2013
Dec. 31,
2012
Assets:
Resale and securities borrowing agreements
Gross amounts recognized 38,635 45,847
Gross amounts offset in consolidated balance sheet (1) (2,817) (2,561)
Net amounts in consolidated balance sheet (2) 35,818 43,286
Noncash collateral not recognized in consolidated balance sheet (3) (35,768) (42,920)
Net amount (4) $ 50 366
Liabilities:
Repurchase and securities lending agreements
Gross amounts recognized 38,032 35,876
Gross amounts offset in consolidated balance sheet (1) (2,817) (2,561)
Net amounts in consolidated balance sheet (5) 35,215 33,315
Noncash collateral pledged but not netted in consolidated balance sheet (6) (34,770) (33,050)
Net amount (7) 445 265
(1) Represents recognized amount of resale and repurchase agreements with counterparties subject to enforceable MRAs or MSLAs that have been offset in the consolidated
balance sheet.
(2) At December 31, 2013 and December 31, 2012, includes $25.7 billion and $33.8 billion, respectively, classified on our consolidated balance sheet in Federal funds sold,
securities purchased under resale agreements and other short-term investments and $10.1 billion and $9.5 billion, respectively, in Loans.
(3) Represents the fair value of non-cash collateral we have received under enforceable MRAs or MSLAs, limited for table presentation purposes to the amount of the recognized
asset due from each counterparty. At December 31, 2013 and December 31, 2012, we have received total collateral with a fair value of $43.3 billion and $46.6 billion,
respectively, all of which, we have the right to sell or repledge. These amounts include securities we have sold or repledged to others with a fair value of $23.8 billion at
December 31, 2013 and $29.7 billion at December 31, 2012.
(4) Represents the amount of our exposure that is not collateralized and/or is not subject to an enforceable MRA or MSLA.
(5) Amount is classified in Short-term borrowings on our consolidated balance sheet.
(6) Represents the fair value of non-cash collateral we have pledged, related to enforceable MRAs or MSLAs, limited for table presentation purposes to the amount of the
recognized liability owed to each counterparty. At December 31, 2013 and December 31, 2012, we have pledged total collateral with a fair value of $39.0 billion and
$36.4 billion, respectively, of which, the counterparty does not have the right to sell or repledge $10.0 billion as of December 31, 2013 and $9.1 billion as of December 31,
2012.
(7) Represents the amount of our exposure that is not covered by pledged collateral and/or is not subject to an enforceable MRA or MSLA.
204