Wells Fargo 2013 Annual Report Download - page 158
Download and view the complete annual report
Please find page 158 of the 2013 Wells Fargo annual report below. You can navigate through the pages in the report by either clicking on the pages listed below, or by using the keyword search tool below to find specific information within the annual report.-
 1
1 -
2
-
3
-
4
-
5
-
6
-
7
-
8
-
9
-
10
-
11
-
12
-
13
-
14
-
15
-
16
-
17
-
18
-
19
-
20
-
21
-
22
-
23
-
24
-
25
-
26
-
27
-
28
-
29
-
30
-
31
-
32
-
33
-
34
-
35
-
36
-
37
-
38
-
39
-
40
-
41
-
42
-
43
-
44
-
45
-
46
-
47
-
48
-
49
-
50
-
51
-
52
-
53
-
54
-
55
-
56
-
57
-
58
-
59
-
60
-
61
-
62
-
63
-
64
-
65
-
66
-
67
-
68
-
69
-
70
-
71
-
72
-
73
-
74
-
75
-
76
-
77
-
78
-
79
-
80
-
81
-
82
-
83
-
84
-
85
-
86
-
87
-
88
-
89
-
90
-
91
-
92
-
93
-
94
-
95
-
96
-
97
-
98
-
99
-
100
-
101
-
102
-
103
-
104
-
105
-
106
-
107
-
108
-
109
-
110
-
111
-
112
-
113
-
114
-
115
-
116
-
117
-
118
-
119
-
120
-
121
-
122
-
123
-
124
-
125
-
126
-
127
-
128
-
129
-
130
-
131
-
132
-
133
-
134
-
135
-
136
-
137
-
138
-
139
-
140
-
141
-
142
-
143
-
144
-
145
-
146
-
147
-
 148
148 -
 149
149 -
 150
150 -
 151
151 -
 152
152 -
 153
153 -
 154
154 -
 155
155 -
 156
156 -
 157
157 -
 158
158 -
 159
159 -
 160
160 -
 161
161 -
 162
162 -
 163
163 -
 164
164 -
 165
165 -
 166
166 -
 167
167 -
 168
168 -
169
-
170
-
171
-
172
-
173
-
174
-
175
-
176
-
177
-
178
-
179
-
180
-
181
-
182
-
183
-
184
-
185
-
186
-
187
-
188
-
189
-
190
-
191
-
192
-
193
-
194
-
195
-
196
-
197
-
198
-
199
-
200
-
201
-
202
-
203
-
204
-
205
-
206
-
207
-
208
-
209
-
210
-
211
-
212
-
213
-
214
-
215
-
216
-
217
-
218
-
219
-
220
-
221
-
222
-
223
-
224
-
225
-
226
-
227
-
228
-
229
-
230
-
231
-
232
-
233
-
234
-
235
-
236
-
237
-
238
-
239
-
240
-
241
-
242
-
243
-
244
-
245
-
246
-
247
-
248
-
249
-
250
-
251
-
252
-
253
-
254
-
255
-
256
-
257
-
258
-
259
-
260
-
261
-
262
-
263
-
264
-
265
-
266
-
267
-
268
-
269
-
270
-
271
-
272
 |
 |

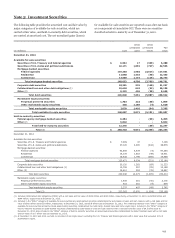
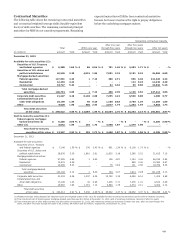
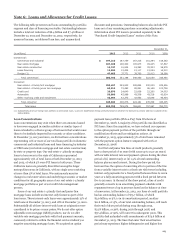
Note 5: Investment Securities (continued)
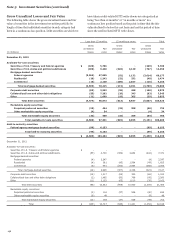
Gross Unrealized Losses and Fair Value
The following table shows the gross unrealized losses and fair
value of securities in the investment securities portfolio by
length of time that individual securities in each category had
been in a continuous loss position. Debt securities on which we
have taken credit-related OTTI write-downs are categorized as
being “less than 12 months” or “12 months or more” in a
continuous loss position based on the point in time that the fair
value declined to below the cost basis and not the period of time
since the credit-related OTTI write-down.
Less than 12 months 12 months or more Total
(in millions)
Gross
unrealized
losses
Fair
value
unrealized
Gross
losses
Fair
value
Gross
unrealized
losses
Fair
value
December 31, 2013
Available-for-sale securities:
Securities of U.S. Treasury and federal agencies $ (329) 5,786 - - (329) 5,786
Securities of U.S. states and political subdivisions (399) 9,238 (328) 4,120 (727) 13,358
Mortgage-backed securities:
Federal agencies (3,562) 67,045 (52) 1,132 (3,614) 68,177
Residential (18) 1,242 (22) 232 (40) 1,474
Commercial (15) 2,128 (100) 2,027 (115) 4,155
Total mortgage-backed securities (3,595) 70,415 (174) 3,391 (3,769) 73,806
Corporate debt securities (85) 2,542 (55) 428 (140) 2,970
Collateralized loan and other debt obligations (55) 7,202 (38) 343 (93) 7,545
Other (11) 1,690 (18) 365 (29) 2,055
Total debt securities (4,474) 96,873 (613) 8,647 (5,087) 105,520
Marketable equity securities:
Perpetual preferred securities (28) 424 (32) 308 (60) 732
Other marketable equity securities (4) 34 - - (4) 34
Total marketable equity securities (32) 458 (32) 308 (64) 766
Total available-for-sale securities (4,506) 97,331 (645) 8,955 (5,151) 106,286
Held-to-maturity securities:
Federal agency mortgage-backed securities (99) 6,153 - - (99) 6,153
Total held-to-maturity securities (99) 6,153 - - (99) 6,153
Total $ (4,605) 103,484 (645) 8,955 (5,250) 112,439
December 31, 2012
Available-for-sale securities:
Securities of U.S. Treasury and federal agencies $ - - - - - -
Securities of U.S. states and political subdivisions (55) 2,709 (389) 4,662 (444) 7,371
Mortgage-backed securities:
Federal agencies (4) 2,247 - - (4) 2,247
Residential (4) 261 (45) 1,564 (49) 1,825
Commercial (6) 491 (262) 2,564 (268) 3,055
Total mortgage-backed securities (14) 2,999 (307) 4,128 (321) 7,127
Corporate debt securities (14) 1,217 (55) 305 (69) 1,522
Collateralized loan and other debt obligations (2) 1,485 (93) 798 (95) 2,283
Other (11) 2,153 (65) 1,010 (76) 3,163
Total debt securities (96) 10,563 (909) 10,903 (1,005) 21,466
Marketable equity securities:
Perpetual preferred securities (3) 116 (37) 538 (40) 654
Other marketable equity securities (9) 48 - - (9) 48
Total marketable equity securities (12) 164 (37) 538 (49) 702
Total $ (108) 10,727 (946) 11,441 (1,054) 22,168
156