Wells Fargo 2013 Annual Report Download - page 82
Download and view the complete annual report
Please find page 82 of the 2013 Wells Fargo annual report below. You can navigate through the pages in the report by either clicking on the pages listed below, or by using the keyword search tool below to find specific information within the annual report.-
 1
1 -
2
-
3
-
4
-
5
-
6
-
7
-
8
-
9
-
10
-
11
-
12
-
13
-
14
-
15
-
16
-
17
-
18
-
19
-
20
-
21
-
22
-
23
-
24
-
25
-
26
-
27
-
28
-
29
-
30
-
31
-
32
-
33
-
34
-
35
-
36
-
37
-
38
-
39
-
40
-
41
-
42
-
43
-
44
-
45
-
46
-
47
-
48
-
49
-
50
-
51
-
52
-
53
-
54
-
55
-
56
-
57
-
58
-
59
-
60
-
61
-
62
-
63
-
64
-
65
-
66
-
67
-
68
-
69
-
70
-
71
-
 72
72 -
 73
73 -
 74
74 -
 75
75 -
 76
76 -
 77
77 -
 78
78 -
 79
79 -
 80
80 -
 81
81 -
 82
82 -
 83
83 -
 84
84 -
 85
85 -
 86
86 -
 87
87 -
 88
88 -
 89
89 -
 90
90 -
 91
91 -
 92
92 -
93
-
94
-
95
-
96
-
97
-
98
-
99
-
100
-
101
-
102
-
103
-
104
-
105
-
106
-
107
-
108
-
109
-
110
-
111
-
112
-
113
-
114
-
115
-
116
-
117
-
118
-
119
-
120
-
121
-
122
-
123
-
124
-
125
-
126
-
127
-
128
-
129
-
130
-
131
-
132
-
133
-
134
-
135
-
136
-
137
-
138
-
139
-
140
-
141
-
142
-
143
-
144
-
145
-
146
-
147
-
148
-
149
-
150
-
151
-
152
-
153
-
154
-
155
-
156
-
157
-
158
-
159
-
160
-
161
-
162
-
163
-
164
-
165
-
166
-
167
-
168
-
169
-
170
-
171
-
172
-
173
-
174
-
175
-
176
-
177
-
178
-
179
-
180
-
181
-
182
-
183
-
184
-
185
-
186
-
187
-
188
-
189
-
190
-
191
-
192
-
193
-
194
-
195
-
196
-
197
-
198
-
199
-
200
-
201
-
202
-
203
-
204
-
205
-
206
-
207
-
208
-
209
-
210
-
211
-
212
-
213
-
214
-
215
-
216
-
217
-
218
-
219
-
220
-
221
-
222
-
223
-
224
-
225
-
226
-
227
-
228
-
229
-
230
-
231
-
232
-
233
-
234
-
235
-
236
-
237
-
238
-
239
-
240
-
241
-
242
-
243
-
244
-
245
-
246
-
247
-
248
-
249
-
250
-
251
-
252
-
253
-
254
-
255
-
256
-
257
-
258
-
259
-
260
-
261
-
262
-
263
-
264
-
265
-
266
-
267
-
268
-
269
-
270
-
271
-
272
 |
 |

Risk Management – Credit Risk Management (continued)
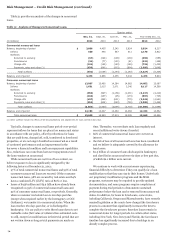
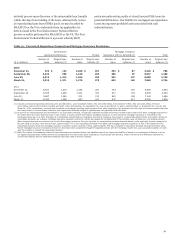
We believe we have a high quality residential mortgage loan
servicing portfolio. Of the $1.8 trillion in the residential
mortgage loan servicing portfolio at December 31, 2013, 94%
was current, less than 2% was subprime at origination, and less
than 1% was related to home equity loan securitizations. Our
combined delinquency and foreclosure rate on this portfolio was
6.40% at December 31, 2013, compared with 7.04% at
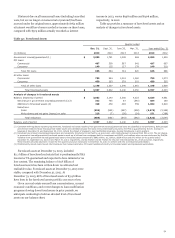
December 31, 2012. Three percent of this portfolio is private
label securitizations for which we originated the loans and
therefore have some repurchase risk. We have observed an
increase in outstanding demands, compared with
December 31, 2012, associated with our pre-2009 private label
securitizations due to an increase in new demands received in
fourth quarter 2013, most of which were anticipated and were
covered through mortgage loan repurchase accruals established
in prior periods. Investors continue to review defaulted loans for
potential breaches of our loan sale representations and
warranties, and we continue to believe the risk of repurchase in
our private label securitizations is substantially reduced, relative
to third-party issued private label securitizations, because
approximately one-half of this portfolio of private label
securitizations does not contain representations and warranties
regarding borrower or other third party misrepresentations
related to the mortgage loan, general compliance with
underwriting guidelines, or property valuation, which are
commonly asserted bases for repurchase. For the 3% private
label securitization segment of our residential mortgage loan
servicing portfolio (weighted-average age of 98 months), 57% are
loans from 2005 vintages or earlier; 76% were prime at
origination; and approximately 60% are jumbo loans. The
weighted-average LTV as of December 31, 2013 for this private
securitization segment was 67%. We believe the highest risk
segment of these private label securitizations is the subprime
loans originated in 2006 and 2007. These subprime loans have
seller representations and warranties and currently have LTVs
close to or exceeding 100%, and represent 10% of the private
label securitization portion of the residential mortgage servicing
portfolio. We had $67 million of repurchases related to private
label securitizations in 2013 compared with $180 million in
2012.
Of the servicing portfolio, 3% is non-agency acquired
servicing and 1% is private whole loan sales. We did not
underwrite and securitize the non-agency acquired servicing and
therefore we have no obligation on that portion of our servicing
portfolio to the investor for any repurchase demands arising
from origination practices. For the private whole loan segment,
while we do have repurchase risk on these loans, less than 2%
were subprime at origination and loans that were sold and
subsequently securitized are included in the private label
securitization segment discussed above.
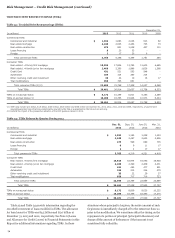
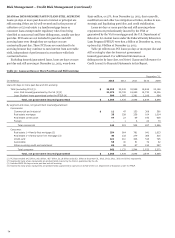
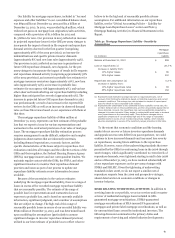
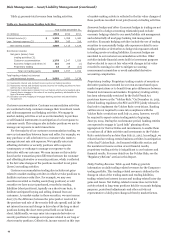
Table 40 summarizes the changes in our mortgage
repurchase liability. We incurred net losses on repurchased
loans and investor reimbursements totalling $481 million on
mortgage loans with original balances of $1.4 billion in 2013,
excluding the $746 million and the $508 million cash payments
for the FHLMC and FNMA settlement agreements, respectively,
compared with net losses of $1.1 billion on mortgage loans with
original balances of $2.5 billion for 2012. Both the FHLMC and
FNMA settlement agreements executed in the third and fourth
quarters of 2013, respectively, were covered through mortgage
loan repurchase accruals established in prior periods.
Table 40: Changes in Mortgage Repurchase Liability
Quarter ended
Year ended Dec. 31,
(in millions)
Dec. 31,
2013
Sept. 30,
2013
June 30,
2013
Mar. 31,
2013 2013 2012 2011
Balance, beginning of period $ 1,421 2,222 2,317 2,206 2,206 1,326 1,289
Provision for repurchase losses:
Loan sales 16 28 40 59 143 275 101
Change in estimate (1) 10 - 25 250 285 1,665 1,184
Total additions 26 28 65 309 428 1,940 1,285
Losses (2) (548) (829) (160) (198) (1,735) (1,060) (1,248)
Balance, end of period $ 899 1,421 2,222 2,317 899 2,206 1,326
(1) Results from changes in investor demand and mortgage insurer practices, credit deterioration and changes in the financial stability of correspondent lenders.
(2) Quarter and year ended September 30 and December 31, 2013, respectively, reflect $746 million as a result of the agreement with FHLMC that resolves substantially all
repurchase liabilities related to loans sold to FHLMC prior to January 1, 2009. Quarter and year ended December 31, 2013, reflect $508 million as a result of the agreement
with FNMA that resolves substantially all repurchase liabilities related to loans sold to FNMA that were originated prior to January 1, 2009.
80