Wells Fargo 2013 Annual Report Download - page 161
Download and view the complete annual report
Please find page 161 of the 2013 Wells Fargo annual report below. You can navigate through the pages in the report by either clicking on the pages listed below, or by using the keyword search tool below to find specific information within the annual report.-
 1
1 -
2
-
3
-
4
-
5
-
6
-
7
-
8
-
9
-
10
-
11
-
12
-
13
-
14
-
15
-
16
-
17
-
18
-
19
-
20
-
21
-
22
-
23
-
24
-
25
-
26
-
27
-
28
-
29
-
30
-
31
-
32
-
33
-
34
-
35
-
36
-
37
-
38
-
39
-
40
-
41
-
42
-
43
-
44
-
45
-
46
-
47
-
48
-
49
-
50
-
51
-
52
-
53
-
54
-
55
-
56
-
57
-
58
-
59
-
60
-
61
-
62
-
63
-
64
-
65
-
66
-
67
-
68
-
69
-
70
-
71
-
72
-
73
-
74
-
75
-
76
-
77
-
78
-
79
-
80
-
81
-
82
-
83
-
84
-
85
-
86
-
87
-
88
-
89
-
90
-
91
-
92
-
93
-
94
-
95
-
96
-
97
-
98
-
99
-
100
-
101
-
102
-
103
-
104
-
105
-
106
-
107
-
108
-
109
-
110
-
111
-
112
-
113
-
114
-
115
-
116
-
117
-
118
-
119
-
120
-
121
-
122
-
123
-
124
-
125
-
126
-
127
-
128
-
129
-
130
-
131
-
132
-
133
-
134
-
135
-
136
-
137
-
138
-
139
-
140
-
141
-
142
-
143
-
144
-
145
-
146
-
147
-
148
-
149
-
150
-
 151
151 -
 152
152 -
 153
153 -
 154
154 -
 155
155 -
 156
156 -
 157
157 -
 158
158 -
 159
159 -
 160
160 -
 161
161 -
 162
162 -
 163
163 -
 164
164 -
 165
165 -
 166
166 -
 167
167 -
 168
168 -
 169
169 -
 170
170 -
 171
171 -
172
-
173
-
174
-
175
-
176
-
177
-
178
-
179
-
180
-
181
-
182
-
183
-
184
-
185
-
186
-
187
-
188
-
189
-
190
-
191
-
192
-
193
-
194
-
195
-
196
-
197
-
198
-
199
-
200
-
201
-
202
-
203
-
204
-
205
-
206
-
207
-
208
-
209
-
210
-
211
-
212
-
213
-
214
-
215
-
216
-
217
-
218
-
219
-
220
-
221
-
222
-
223
-
224
-
225
-
226
-
227
-
228
-
229
-
230
-
231
-
232
-
233
-
234
-
235
-
236
-
237
-
238
-
239
-
240
-
241
-
242
-
243
-
244
-
245
-
246
-
247
-
248
-
249
-
250
-
251
-
252
-
253
-
254
-
255
-
256
-
257
-
258
-
259
-
260
-
261
-
262
-
263
-
264
-
265
-
266
-
267
-
268
-
269
-
270
-
271
-
272
 |
 |

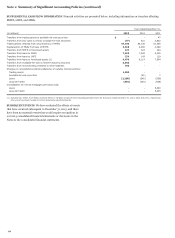
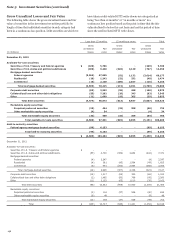
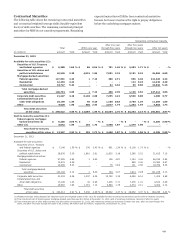
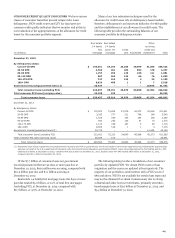
Contractual Maturities
The following table shows the remaining contractual maturities
and contractual weighted-average yields (taxable-equivalent
basis) of debt securities. The remaining contractual principal
maturities for MBS do not consider prepayments. Remaining
expected maturities will differ from contractual maturities
because borrowers may have the right to prepay obligations
before the underlying mortgages mature.
Remaining contractual maturity
Total Within one year
After one year
through five years
After five years
through ten years After ten years
(in millions) amount Yield Amount Yield Amount Yield Amount Yield Amount Yield
December 31, 2013
Available-for-sale securities (1):
Securities of U.S. Treasury
and federal agencies $ 6,280 1.66 % $ 86 0.54 % $ 701 1.45 % $ 5,493 1.71 % $ - - %
Securities of U.S. states and
political subdivisions 42,536 5.30 4,915 1.84 7,901 2.19 3,151 5.19 26,569 6.89
Mortgage-backed securities:
Federal agencies 117,591 3.33 1 7.14 398 2.71 956 3.46 116,236 3.33
Residential 12,453 4.31 - - - - 113 5.43 12,340 4.30
Commercial 18,747 5.24 - - 52 3.33 59 0.96 18,636 5.26
Total mortgage-backed
securities 148,791 3.65 1 7.14 450 2.78 1,128 3.52 147,212 3.66
Corporate debt securities 21,227 4.18 6,136 2.06 7,255 4.22 6,528 5.80 1,308 5.77
Collateralized loan and
other debt obligations 20,159 1.59 40 0.25 1,100 0.63 7,750 1.29 11,269 1.89
Other 9,629 1.80 906 2.53 2,977 1.74 1,243 1.64 4,503 1.73
Total debt securities
at fair value $ 248,622 3.69 % $ 12,084 1.99 % $ 20,384 2.75 % $ 25,293 3.14 % $ 190,861 3.97 %
Held-to-maturity securities (1):
Federal agency mortgage-
backed securities (2) $ 6,205 3.90 % $ - - % $ - - % $ - - % $ 6,205 3.90 %
Other (3) 6,042 1.89 195 1.72 4,468 1.87 1,379 1.98 - -
Total held-to-maturity
securities at fair value $ 12,247 2.92 % $ 195 1.72 % $ 4,468 1.87 % $ 1,379 1.98 % $ 6,205 3.90 %
December 31, 2012
Available-for-sale securities:
Securities of U.S. Treasury
and federal agencies $ 7,146 1.59 % $ 376 0.43 % $ 661 1.24 % $ 6,109 1.70 % $ --%
Securities of U.S. states and
political subdivisions 38,676 5.29 1,861 2.61 11,620 2.18 3,380 5.51 21,815 7.15
Mortgage-backed securities:
Federal agencies 97,285 3.82 1 5.40 106 4.87 1,144 3.41 96,034 3.83
Residential 15,931 4.38 ----569 2.06 15,362 4.47
Commercial 19,968 5.33 --78 3.69 101 2.84 19,789 5.35
Total mortgage-backed
securities 133,184 4.12 1 5.40 184 4.37 1,814 2.95 131,185 4.13
Corporate debt securities 21,333 4.26 1,037 4.29 12,792 3.19 6,099 6.14 1,405 5.88
Collateralized loan and
other debt obligations 13,188 1.35 44 0.96 1,246 0.71 7,376 1.01 4,522 2.08
Other 18,887 1.85 1,715 1.14 9,589 1.75 3,274 2.11 4,309 2.14
Total debt securities
at fair value $ 232,414 3.91 % $ 5,034 2.28 % $ 36,092 2.37 % $ 28,052 3.07 % $ 163,236 4.44 %
(1) Weighted-average yields displayed by maturity bucket are weighted based on fair value for available-for-sale securities and amortized cost for held-to-maturity securities.
(2) Total amortized cost of federal agency mortgage-backed securities was $6.3 billion at December 31, 2013, with a remaining contractual maturity of after ten years.
(3) Total amortized cost of other debt securities was $6.0 billion at December 31, 2013, with remaining contractual maturities of within one year, after one year through five
years, and after five years through ten years of $0.2 billion, $4.4 billion and $1.4 billion, respectively, at December 31, 2013.
159