Wells Fargo 2013 Annual Report Download - page 193
Download and view the complete annual report
Please find page 193 of the 2013 Wells Fargo annual report below. You can navigate through the pages in the report by either clicking on the pages listed below, or by using the keyword search tool below to find specific information within the annual report.-
 1
1 -
2
-
3
-
4
-
5
-
6
-
7
-
8
-
9
-
10
-
11
-
12
-
13
-
14
-
15
-
16
-
17
-
18
-
19
-
20
-
21
-
22
-
23
-
24
-
25
-
26
-
27
-
28
-
29
-
30
-
31
-
32
-
33
-
34
-
35
-
36
-
37
-
38
-
39
-
40
-
41
-
42
-
43
-
44
-
45
-
46
-
47
-
48
-
49
-
50
-
51
-
52
-
53
-
54
-
55
-
56
-
57
-
58
-
59
-
60
-
61
-
62
-
63
-
64
-
65
-
66
-
67
-
68
-
69
-
70
-
71
-
72
-
73
-
74
-
75
-
76
-
77
-
78
-
79
-
80
-
81
-
82
-
83
-
84
-
85
-
86
-
87
-
88
-
89
-
90
-
91
-
92
-
93
-
94
-
95
-
96
-
97
-
98
-
99
-
100
-
101
-
102
-
103
-
104
-
105
-
106
-
107
-
108
-
109
-
110
-
111
-
112
-
113
-
114
-
115
-
116
-
117
-
118
-
119
-
120
-
121
-
122
-
123
-
124
-
125
-
126
-
127
-
128
-
129
-
130
-
131
-
132
-
133
-
134
-
135
-
136
-
137
-
138
-
139
-
140
-
141
-
142
-
143
-
144
-
145
-
146
-
147
-
148
-
149
-
150
-
151
-
152
-
153
-
154
-
155
-
156
-
157
-
158
-
159
-
160
-
161
-
162
-
163
-
164
-
165
-
166
-
167
-
168
-
169
-
170
-
171
-
172
-
173
-
174
-
175
-
176
-
177
-
178
-
179
-
180
-
181
-
182
-
 183
183 -
 184
184 -
 185
185 -
 186
186 -
 187
187 -
 188
188 -
 189
189 -
 190
190 -
 191
191 -
 192
192 -
 193
193 -
 194
194 -
 195
195 -
 196
196 -
 197
197 -
 198
198 -
 199
199 -
 200
200 -
 201
201 -
 202
202 -
 203
203 -
204
-
205
-
206
-
207
-
208
-
209
-
210
-
211
-
212
-
213
-
214
-
215
-
216
-
217
-
218
-
219
-
220
-
221
-
222
-
223
-
224
-
225
-
226
-
227
-
228
-
229
-
230
-
231
-
232
-
233
-
234
-
235
-
236
-
237
-
238
-
239
-
240
-
241
-
242
-
243
-
244
-
245
-
246
-
247
-
248
-
249
-
250
-
251
-
252
-
253
-
254
-
255
-
256
-
257
-
258
-
259
-
260
-
261
-
262
-
263
-
264
-
265
-
266
-
267
-
268
-
269
-
270
-
271
-
272
 |
 |

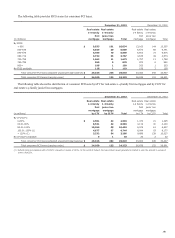
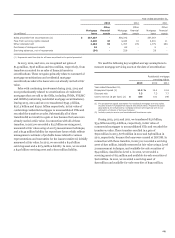
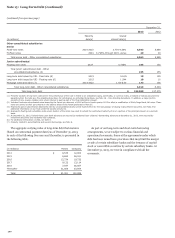
In addition to residential mortgage servicing rights (MSRs)
included in the previous table, we have a small portfolio of
commercial MSRs with a fair value of $1.6 billion and
$1.4 billion at December 31, 2013, and December 31, 2012,
respectively. The nature of our commercial MSRs, which are
carried at LOCOM, is different from our residential MSRs.
Prepayment activity on serviced loans does not significantly
impact the value of commercial MSRs because, unlike residential
mortgages, commercial mortgages experience significantly lower
prepayments due to certain contractual restrictions, impacting
the borrower’s ability to prepay the mortgage. Additionally, for
our commercial MSR portfolio, we are typically master/primary
servicer, but not the special servicer, who is separately
responsible for the servicing and workout of delinquent and
foreclosed loans. It is the special servicer, similar to our role as
servicer of residential mortgage loans, who is affected by higher
servicing and foreclosure costs due to an increase in delinquent
and foreclosed loans. Accordingly, prepayment speeds and costs
to service are not key assumptions for commercial MSRs as they
do not significantly impact the valuation. The primary economic
driver impacting the fair value of our commercial MSRs is
forward interest rates, which are derived from market
observable yield curves used to price capital markets
instruments. Market interest rates most significantly affect
interest earned on custodial deposit balances. The sensitivity of
the current fair value to an immediate adverse 25% change in the
assumption about interest earned on deposit balances at
December 31, 2013, and 2012, results in a decrease in fair value
of $175 million and $139 million, respectively. See Note 9 for
further information on our commercial MSRs.
The sensitivities in the preceding paragraph and table are
hypothetical and caution should be exercised when relying on
this data. Changes in value based on variations in assumptions
generally cannot be extrapolated because the relationship of the
change in the assumption to the change in value may not be
linear. Also, the effect of a variation in a particular assumption
on the value of the other interests held is calculated
independently without changing any other assumptions. In
reality, changes in one factor may result in changes in others (for
example, changes in prepayment speed estimates could result in
changes in the credit losses), which might magnify or counteract
the sensitivities.
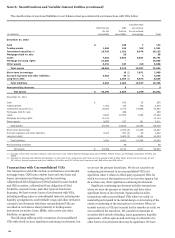
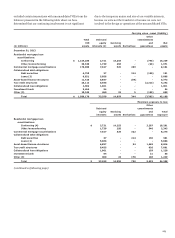
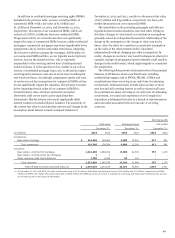
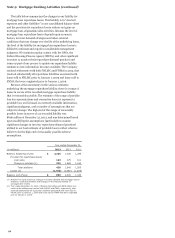
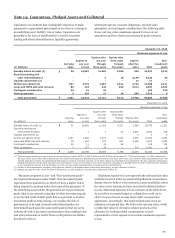
The following table presents information about the principal
balances of off-balance sheet securitized loans, including
residential mortgages sold to FNMA, FHLMC, GNMA and
securitizations where servicing is our only form of continuing
involvement. Delinquent loans include loans 90 days or more
past due and still accruing interest as well as nonaccrual loans.
In securitizations where servicing is our only form of continuing
involvement, we would only experience a loss if required to
repurchase a delinquent loan due to a breach in representations
and warranties associated with our loan sale or servicing
contracts.
Total loans Delinquent loans
Net charge-offs
December 31, December 31,
Year ended
December 31,
(in millions) 2013 2012 2013 2012 2013 2012
Commercial:
Real estate mortgage $ 119,346 128,564 8,808 12,216 617 541
Total commercial 119,346 128,564 8,808 12,216 617 541
Consumer:
Real estate 1-4 family first mortgage 1,313,298 1,283,504 17,009 21,574 797 1,170
Real estate 1-4 family junior lien mortgage 1 1 ----
Other revolving credit and installment 1,790 2,034 99 110 --
Total consumer 1,315,089 1,285,539 17,108 21,684 797 1,170
Total off-balance sheet securitized loans (1) $ 1,434,435 1,414,103 25,916 33,900 1,414 1,711
(1) At December 31, 2013 and 2012, the table includes total loans of $1.3 trillion at both dates and delinquent loans of $14.0 billion and $17.4 billion, respectively for FNMA,
FHLMC and GNMA. Net charge-offs exclude loans sold to FNMA, FHLMC and GNMA as we do not service or manage the underlying real estate upon foreclosure and, as such,
do not have access to net charge-off information.
191