Wells Fargo 2013 Annual Report Download - page 209
Download and view the complete annual report
Please find page 209 of the 2013 Wells Fargo annual report below. You can navigate through the pages in the report by either clicking on the pages listed below, or by using the keyword search tool below to find specific information within the annual report.-
 1
1 -
2
-
3
-
4
-
5
-
6
-
7
-
8
-
9
-
10
-
11
-
12
-
13
-
14
-
15
-
16
-
17
-
18
-
19
-
20
-
21
-
22
-
23
-
24
-
25
-
26
-
27
-
28
-
29
-
30
-
31
-
32
-
33
-
34
-
35
-
36
-
37
-
38
-
39
-
40
-
41
-
42
-
43
-
44
-
45
-
46
-
47
-
48
-
49
-
50
-
51
-
52
-
53
-
54
-
55
-
56
-
57
-
58
-
59
-
60
-
61
-
62
-
63
-
64
-
65
-
66
-
67
-
68
-
69
-
70
-
71
-
72
-
73
-
74
-
75
-
76
-
77
-
78
-
79
-
80
-
81
-
82
-
83
-
84
-
85
-
86
-
87
-
88
-
89
-
90
-
91
-
92
-
93
-
94
-
95
-
96
-
97
-
98
-
99
-
100
-
101
-
102
-
103
-
104
-
105
-
106
-
107
-
108
-
109
-
110
-
111
-
112
-
113
-
114
-
115
-
116
-
117
-
118
-
119
-
120
-
121
-
122
-
123
-
124
-
125
-
126
-
127
-
128
-
129
-
130
-
131
-
132
-
133
-
134
-
135
-
136
-
137
-
138
-
139
-
140
-
141
-
142
-
143
-
144
-
145
-
146
-
147
-
148
-
149
-
150
-
151
-
152
-
153
-
154
-
155
-
156
-
157
-
158
-
159
-
160
-
161
-
162
-
163
-
164
-
165
-
166
-
167
-
168
-
169
-
170
-
171
-
172
-
173
-
174
-
175
-
176
-
177
-
178
-
179
-
180
-
181
-
182
-
183
-
184
-
185
-
186
-
187
-
188
-
189
-
190
-
191
-
192
-
193
-
194
-
195
-
196
-
197
-
198
-
 199
199 -
 200
200 -
 201
201 -
 202
202 -
 203
203 -
 204
204 -
 205
205 -
 206
206 -
 207
207 -
 208
208 -
 209
209 -
 210
210 -
 211
211 -
 212
212 -
 213
213 -
 214
214 -
 215
215 -
 216
216 -
 217
217 -
 218
218 -
 219
219 -
220
-
221
-
222
-
223
-
224
-
225
-
226
-
227
-
228
-
229
-
230
-
231
-
232
-
233
-
234
-
235
-
236
-
237
-
238
-
239
-
240
-
241
-
242
-
243
-
244
-
245
-
246
-
247
-
248
-
249
-
250
-
251
-
252
-
253
-
254
-
255
-
256
-
257
-
258
-
259
-
260
-
261
-
262
-
263
-
264
-
265
-
266
-
267
-
268
-
269
-
270
-
271
-
272
 |
 |
207
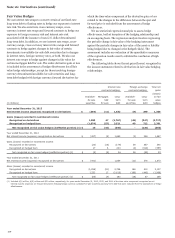
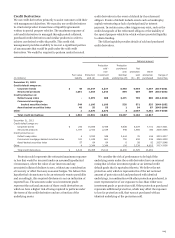
values of assets and liabilities, and cash flows caused by interest
rate, foreign currency and other market value volatility. This
approach involves modifying the repricing characteristics of
certain assets and liabilities so that changes in interest rates,
foreign currency and other exposures do not have a significantly
adverse effect on the net interest margin, cash flows and
earnings. As a result of fluctuations in these exposures, hedged
assets and liabilities will gain or lose market value. In a fair value
or economic hedge, the effect of this unrealized gain or loss will
generally be offset by the gain or loss on the derivatives linked to
the hedged assets and liabilities. In a cash flow hedge, where we
manage the variability of cash payments due to interest rate
fluctuations by the effective use of derivatives linked to hedged
assets and liabilities, the unrealized gain or loss on the
derivatives or the hedged asset or liability is generally reflected
in other comprehensive income and not in earnings.
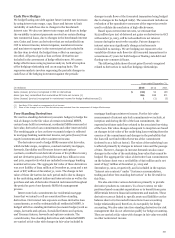
We also offer various derivatives, including interest rate,
commodity, equity, credit and foreign exchange contracts, to our
customers as part of our trading businesses but usually offset our
exposure from such contracts by entering into other financial
contracts. These derivative transactions are conducted in an
effort to help customers manage their market price risks. The
customer accommodations and any offsetting derivative
contracts are treated as free-standing derivatives. To a much
lesser extent, we take positions executed for our own account
based on market expectations or to benefit from price
differentials between financial instruments and markets.
Additionally, free-standing derivatives include embedded
derivatives that are required to be accounted for separately from
their host contracts.
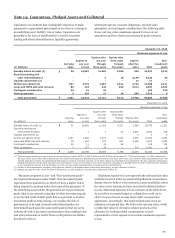
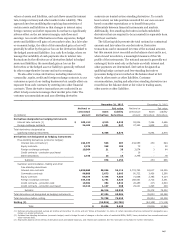
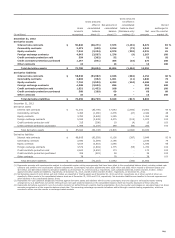
The following table presents the total notional or contractual
amounts and fair values for our derivatives. Derivative
transactions can be measured in terms of the notional amount,
but this amount is not recorded on the balance sheet and is not,
when viewed in isolation, a meaningful measure of the risk
profile of the instruments. The notional amount is generally not
exchanged, but is used only as the basis on which interest and
other payments are determined. Derivatives designated as
qualifying hedge contracts and free-standing derivatives
(economic hedges) are recorded on the balance sheet at fair
value in other assets or other liabilities. Customer
accommodation, trading and other free-standing derivatives are
recorded on the balance sheet at fair value in trading assets,
other assets or other liabilities.
-
- - - - -
-
$
$
December 31, 2013 December 31, 2012
Fair value Fair value
(in millions)
Notional or
contractual
amount
Asset
derivatives
Liability
derivatives
Notional or
contractual
amount
Asset
derivatives
Liability
derivatives
Derivatives designated as hedging instruments
Interest rate contracts (1) 100,412 4,315 2,528 92,004 7,284 2,696
Foreign exchange contracts 26,483 1,091 847 27,382 1,808 274
Total derivatives designated as
qualifying hedging instruments 5,406 3,375 9,092 2,970
Derivatives not designated as hedging instruments
Free-standing derivatives (economic hedges):
Interest rate contracts (2) 220,577 595 897 334,555 450 694
Equity contracts 3,273 349 206 75 50
Foreign exchange contracts 10,064 21 35 3,074 3 64
Credit contracts - protection purchased 16
Other derivatives 2,160 13 16 2,296 78
Subtotal 978 1,154 453 886
Customer accommodation, trading and other
free-standing derivatives:
Interest rate contracts 4,030,068 50,936 53,113 2,774,783 63,617 65,305
Commodity contracts 96,889 2,673 2,603 90,732 3,456 3,590
Equity contracts 96,379 7,475 7,588 71,958 3,783 4,114
Foreign exchange contracts 164,160 3,731 3,626 166,061 3,713 3,241
Credit contracts - protection sold 19,501 354 1,532 26,455 315 2,623
Credit contracts - protection purchased 23,314 1,147 368 29,021 1,495 329
Subtotal 66,316 68,830 76,379 79,202
Total derivatives not designated as hedging instruments 67,294 69,984 76,832 80,088
Total derivatives before netting 72,700 73,359 85,924 83,058
Netting (3) (56,894) (63,739) (62,108) (71,116)
Total 15,806 9,620 23,816 11,942
(1) Notional amounts presented exclude $1.9 billion at December 31, 2013, and $4.7 billion at December 31, 2012, of certain derivatives that are combined for designation as a
hedge on a single instrument.
(2) Includes free-standing derivatives (economic hedges) used to hedge the risk of changes in the fair value of residential MSRs, MHFS, loans, derivative loan commitments and
other interests held.
(3) Represents balance sheet netting of derivative asset and liability balances, and related cash collateral. See the next table in this Note for further information.