Singapore Airlines 2002 Annual Report Download - page 95
Download and view the complete annual report
Please find page 95 of the 2002 Singapore Airlines annual report below. You can navigate through the pages in the report by either clicking on the pages listed below, or by using the keyword search tool below to find specific information within the annual report.-
 1
1 -
2
-
3
-
4
-
5
-
6
-
7
-
8
-
9
-
10
-
11
-
12
-
13
-
14
-
15
-
16
-
17
-
18
-
19
-
20
-
21
-
22
-
23
-
24
-
25
-
26
-
27
-
28
-
29
-
30
-
31
-
32
-
33
-
34
-
35
-
36
-
37
-
38
-
39
-
40
-
41
-
42
-
43
-
44
-
45
-
46
-
47
-
48
-
49
-
50
-
51
-
52
-
53
-
54
-
55
-
56
-
57
-
58
-
59
-
60
-
61
-
62
-
63
-
64
-
65
-
66
-
67
-
68
-
69
-
70
-
71
-
72
-
73
-
74
-
75
-
76
-
77
-
78
-
79
-
80
-
81
-
82
-
83
-
84
-
 85
85 -
 86
86 -
 87
87 -
 88
88 -
 89
89 -
 90
90 -
 91
91 -
 92
92 -
 93
93 -
 94
94 -
 95
95 -
 96
96 -
 97
97 -
 98
98 -
 99
99 -
 100
100 -
 101
101 -
 102
102 -
 103
103 -
 104
104 -
 105
105 -
106
-
107
-
108
-
109
-
110
-
111
-
112
-
113
-
114
-
115
-
116
 |
 |

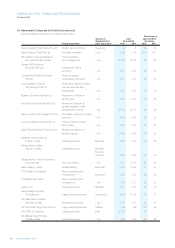
31 Employee Benefits (continued)
Terms of share options outstanding as at 31 March 2002:-
SIA ESOP
Exercise period Exercise price Number outstanding Number exercisable
28.3.2001 – 27.3.2010 $15.34 1,288,237 1,288,237
28.3.2002 – 27.3.2010 $15.34 9,445,917 9,445,917
28.3.2003 – 27.3.2010 $15.34 1,288,237 –
28.3.2004 – 27.3.2010 $15.34 1,288,239 –
3.7.2001 – 2.7.2010 $16.65 1,476,387 1,476,387
3.7.2002 – 2.7.2010 $16.65 7,543,987 –
3.7.2003 – 2.7.2010 $16.65 1,476,387 –
3.7.2004 – 2.7.2010 $16.65 1,476,389 –
2.7.2002 – 1.7.2011 $11.96 1,770,886 –
2.7.2003 – 1.7.2011 $11.96 7,973,481 –
2.7.2004 – 1.7.2011 $11.96 1,770,886 –
2.7.2005 – 1.7.2011 $11.96 1,770,887 –
Total number of options issued 38,569,920 12,210,541
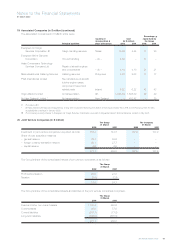
SATS ESOP
Exercise period Exercise price Number outstanding Number exercisable
28.3.2001 – 27.3.2010 $2.50 275,150 275,150
28.3.2002 – 27.3.2010 $2.50 17,324,550 17,324,550
28.3.2003 – 27.3.2010 $2.50 275,150 –
28.3.2004 – 27.3.2010 $2.50 275,150 –
3.7.2001 – 2.7.2010 $2.10 359,500 359,500
3.7.2002 – 2.7.2010 $2.10 12,838,800 –
3.7.2003 – 2.7.2010 $2.10 359,500 –
3.7.2004 – 2.7.2010 $2.10 359,500 –
2.7.2002 – 1.7.2011 $1.54 469,300 –
2.7.2003 – 1.7.2011 $1.54 13,835,500 –
2.7.2004 – 1.7.2011 $1.54 469,300 –
2.7.2005 – 1.7.2011 $1.54 469,300 –
Total number of options issued 47,310,700 17,959,200
SIAEC ESOP
Exercise period Exercise price Number outstanding Number exercisable
28.3.2001 – 27.3.2010 $2.05 322,012 322,012
28.3.2002 – 27.3.2010 $2.05 14,113,612 14,113,612
28.3.2003 – 27.3.2010 $2.05 322,013 –
28.3.2004 – 27.3.2010 $2.05 322,013 –
3.7.2001 – 2.7.2010 $1.95 561,887 561,887
3.7.2002 – 2.7.2010 $1.95 12,382,087 –
3.7.2003 – 2.7.2010 $1.95 561,888 –
3.7.2004 – 2.7.2010 $1.95 561,888 –
2.7.2002 – 1.7.2011 $1.41 772,550 –
2.7.2003 – 1.7.2011 $1.41 13,113,350 –
2.7.2004 – 1.7.2011 $1.41 772,550 –
2.7.2005 – 1.7.2011 $1.41 772,550 –
Total number of options issued 44,578,400 14,997,511
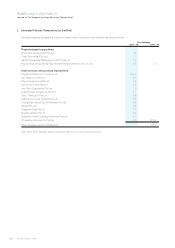
The Company contributes to several post-employment defined benefit plans for certain employees at several overseas locations.
Employees may contribute in some of these plans and these contributions are matched in varying amounts by the Company. Defined
benefit expenses for the Company were $4.1 million for 2001-02 and $4.9 million for 2000-01. As these only represent 5.0% and
6.3% of the Company’s total contributions to post-employment plans for 2001-02 and 2000-01 respectively, additional disclosures of
these defined benefit plans have not been shown due to their immateriality.
Notes to the Financial Statements
31 March 2002
SIA Annual Report 01/02 95