Singapore Airlines 2002 Annual Report Download - page 104
Download and view the complete annual report
Please find page 104 of the 2002 Singapore Airlines annual report below. You can navigate through the pages in the report by either clicking on the pages listed below, or by using the keyword search tool below to find specific information within the annual report.-
 1
1 -
2
-
3
-
4
-
5
-
6
-
7
-
8
-
9
-
10
-
11
-
12
-
13
-
14
-
15
-
16
-
17
-
18
-
19
-
20
-
21
-
22
-
23
-
24
-
25
-
26
-
27
-
28
-
29
-
30
-
31
-
32
-
33
-
34
-
35
-
36
-
37
-
38
-
39
-
40
-
41
-
42
-
43
-
44
-
45
-
46
-
47
-
48
-
49
-
50
-
51
-
52
-
53
-
54
-
55
-
56
-
57
-
58
-
59
-
60
-
61
-
62
-
63
-
64
-
65
-
66
-
67
-
68
-
69
-
70
-
71
-
72
-
73
-
74
-
75
-
76
-
77
-
78
-
79
-
80
-
81
-
82
-
83
-
84
-
85
-
86
-
87
-
88
-
89
-
90
-
91
-
92
-
93
-
 94
94 -
 95
95 -
 96
96 -
 97
97 -
 98
98 -
 99
99 -
 100
100 -
 101
101 -
 102
102 -
 103
103 -
 104
104 -
 105
105 -
 106
106 -
 107
107 -
 108
108 -
 109
109 -
 110
110 -
 111
111 -
 112
112 -
 113
113 -
 114
114 -
115
-
116
 |
 |

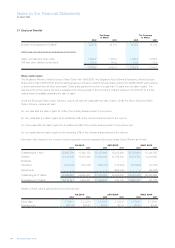
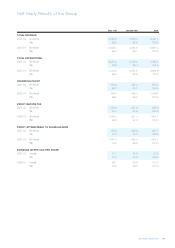
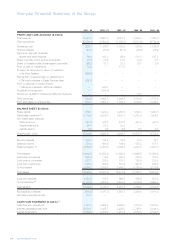
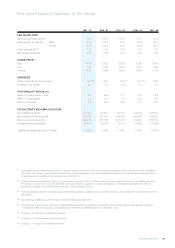
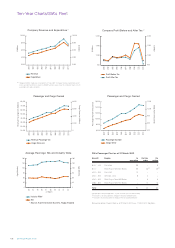
Five-year Financial Summary of the Group
SIA Annual Report 01/02
104
2001 - 02 2000 - 01 1999 - 00 1998 - 99 1997 - 98
PROFIT AND LOSS ACCOUNT ($ million)
Total revenue 9,447.8 9,951.3 9,018.8 7,895.8 7,821.8
Total expenditure (8,464.4) (8,604.6) (7,850.0) (7,011.9) (6,794.9)
Operating profit 983.4 1,346.7 1,168.8 883.9 1,026.9
Finance charges (44.0) (37.5) (28.8) (29.5) (28.2)
Surplus on disposal of aircraft,
spares and spare engines 66.0 181.3 98.4 211.3 157.1
Share of profits of joint venture companies 20.5 27.0 21.0 13.9 7.1
Share of (losses)/profits of associated companies (66.2) 81.7 33.2 23.1 8.9
Profit on sale of investments 30.2 – 171.3 – –
Provision for diminution in value of investment
in Air New Zealand (266.9) ––––
Recognition of deferred gain on divestment of
51% equity interests in Eagle Services Asia 202.6 ––––
Profit on disposal of vendor shares
(13% equity interests in SATS and SIAEC) – 440.1 – – –
Ex-gratia bonus payment – (134.6) – – –
Surplus on liquidation of Abacus Distribution Systems – – – 14.1 –
Profit before tax 925.6 1,904.7 1,463.9 1,116.8 1,171.8
Profit attributable to shareholders 631.7 1,624.8 1,163.8 1,033.2 1,034.7
BALANCE SHEET ($ million)
Share capital 609.1 1,220.2 1,250.5 1,282.5 1,282.5
Distributable reserves R1 8,719.0 8,256.0 7,531.7 8,821.8 7,986.4
Non-distributable reserves
Share premium 447.2 447.2 447.2 447.2 447.2
Capital redemption 64.4 62.3 32.0 – –
Capital reserve 6.9 6.9 6.9 6.3 6.3
Shareholders’ funds 9,846.6 9,992.6 9,268.3 10,557.8 9,722.4
Minority interests 228.7 184.5 19.6 18.3 14.1
Deferred income 788.4 890.9 786.0 578.2 177.1
Deferred taxation R2 2,664.5 2,425.6 2,333.2 2,247.2 2,241.5
Fixed assets 14,442.9 12,863.0 11,882.0 11,666.8 11,398.0
Associated companies 385.8 715.4 305.7 223.0 102.8
Joint venture companies 277.1 239.0 188.2 152.8 125.5
Long-term investments 590.4 556.0 537.8 943.7 936.5
Current assets 2,884.2 3,538.5 3,504.2 4,181.4 3,110.6
Total assets 18,580.4 17,911.9 16,417.9 17,167.7 15,673.4
Long-term liabilities 1,928.9 795.5 566.5 565.6 523.3
Current liabilities R1 3,123.3 3,622.8 3,444.3 3,200.6 2,995.0
Total liabilities 5,052.2 4,418.3 4,010.8 3,766.2 3,518.3
Net (debt)/liquid assets (656.4) 1,417.8 1,647.1 2,493.0 1,511.8
Net debt equity ratio (times) 0.07 ––––
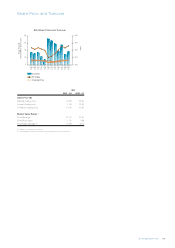
CASH FLOW STATEMENT ($ million) R3
Cash flow from operations 1,421.1 2,644.7 2,429.0 1,772.9 2,070.4
Internally generated cash flow 3,054.1 3,438.7 3,239.3 2,798.1 3,144.3
Capital expenditure 3,862.9 2,589.0 1,911.5 2,053.1 2,120.5