Singapore Airlines 2002 Annual Report Download - page 50
Download and view the complete annual report
Please find page 50 of the 2002 Singapore Airlines annual report below. You can navigate through the pages in the report by either clicking on the pages listed below, or by using the keyword search tool below to find specific information within the annual report.-
 1
1 -
2
-
3
-
4
-
5
-
6
-
7
-
8
-
9
-
10
-
11
-
12
-
13
-
14
-
15
-
16
-
17
-
18
-
19
-
20
-
21
-
22
-
23
-
24
-
25
-
26
-
27
-
28
-
29
-
30
-
31
-
32
-
33
-
34
-
35
-
36
-
37
-
38
-
39
-
 40
40 -
 41
41 -
 42
42 -
 43
43 -
 44
44 -
 45
45 -
 46
46 -
 47
47 -
 48
48 -
 49
49 -
 50
50 -
 51
51 -
 52
52 -
 53
53 -
 54
54 -
 55
55 -
 56
56 -
 57
57 -
 58
58 -
 59
59 -
 60
60 -
61
-
62
-
63
-
64
-
65
-
66
-
67
-
68
-
69
-
70
-
71
-
72
-
73
-
74
-
75
-
76
-
77
-
78
-
79
-
80
-
81
-
82
-
83
-
84
-
85
-
86
-
87
-
88
-
89
-
90
-
91
-
92
-
93
-
94
-
95
-
96
-
97
-
98
-
99
-
100
-
101
-
102
-
103
-
104
-
105
-
106
-
107
-
108
-
109
-
110
-
111
-
112
-
113
-
114
-
115
-
116
 |
 |

Financial Review
SIA Annual Report 01/02
50
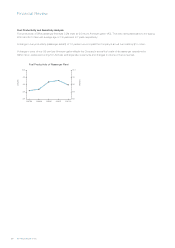
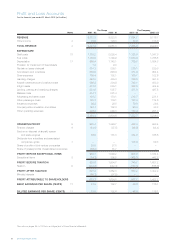
Fuel Productivity and Sensitivity Analysis
Fuel productivity of SIA’s passenger fleet was 3.2% lower at 9.0 ltk per American gallon (AG). This was mainly attributable to the ageing
B744 and A313 fleet with average age of 7.9 years and 9.7 years respectively.
A change in fuel productivity (passenger aircraft) of 1.0 percent would impact the Company’s annual fuel costs by $13 million.
A change in price of one US cent per American gallon affects the Company’s annual fuel costs of its passenger operations by
S$19 million, before accounting for US Dollar exchange rate movements and changes in volume of fuel consumed.
Fuel Productivity of Passenger Fleet
LTK/AG
LTK/AG
1997/98 1998/99 1999/00 2000/01 2001/02
10.0
9.5
9.0
8.5
8.0
10.0
9.5
9.0
8.5
8.0