Singapore Airlines 2002 Annual Report Download - page 105
Download and view the complete annual report
Please find page 105 of the 2002 Singapore Airlines annual report below. You can navigate through the pages in the report by either clicking on the pages listed below, or by using the keyword search tool below to find specific information within the annual report.-
 1
1 -
2
-
3
-
4
-
5
-
6
-
7
-
8
-
9
-
10
-
11
-
12
-
13
-
14
-
15
-
16
-
17
-
18
-
19
-
20
-
21
-
22
-
23
-
24
-
25
-
26
-
27
-
28
-
29
-
30
-
31
-
32
-
33
-
34
-
35
-
36
-
37
-
38
-
39
-
40
-
41
-
42
-
43
-
44
-
45
-
46
-
47
-
48
-
49
-
50
-
51
-
52
-
53
-
54
-
55
-
56
-
57
-
58
-
59
-
60
-
61
-
62
-
63
-
64
-
65
-
66
-
67
-
68
-
69
-
70
-
71
-
72
-
73
-
74
-
75
-
76
-
77
-
78
-
79
-
80
-
81
-
82
-
83
-
84
-
85
-
86
-
87
-
88
-
89
-
90
-
91
-
92
-
93
-
94
-
 95
95 -
 96
96 -
 97
97 -
 98
98 -
 99
99 -
 100
100 -
 101
101 -
 102
102 -
 103
103 -
 104
104 -
 105
105 -
 106
106 -
 107
107 -
 108
108 -
 109
109 -
 110
110 -
 111
111 -
 112
112 -
 113
113 -
 114
114 -
 115
115 -
116
 |
 |

105
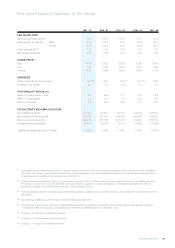
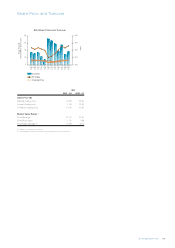
2001 - 02 2000 - 01 1999 - 00 1998 - 99 1997 - 98
PER SHARE DATA
Earnings before tax (cents) 76.0 155.5 115.0 87.1 91.4
Earnings after tax (cents) – basic 51.9 132.7 91.4 80.6 80.7
– diluted 51.9 132.6 91.4 80.6 80.7
Cash earnings ($) R4 1.31 2.26 1.86 1.72 1.64
Net tangible assets ($) 8.08 8.19 7.41 8.23 7.58
SHARE PRICE R5
High 14.90 19.20 20.80 13.60 13.90
Low 7.00 12.90 12.40 6.40 9.20
Closing 14.40 13.60 16.00 12.50 11.50
DIVIDENDS
Gross dividends (cents per share) 15.0 R6 35.0 30.0 R7 25.0 R8 22.5
Dividend cover (times) 4.1 5.1 3.9 4.3 4.8
PROFITABILITY RATIOS (%)
Return on shareholders’ funds 6.4 16.9 11.7 10.2 10.9
Return on total assets 3.8 9.7 7.0 6.3 6.9
Return on turnover 7.3 16.7 12.9 13.1 13.3
PRODUCTIVITY AND EMPLOYEE DATA
Value added ($ million) 2,718.2 5,180.7 4,551.5 4,097.6 4,108.4
Value added per employee ($) 126,832 182,831 165,431 146,836 146,917
Revenue per employee ($) 322,275 351,189 327,801 282,943 279,710
Average employee strength 29,316 28,336 27,513 27,906 27,964
US$/S$ exchange rate as at 31 March 1.8405 1.8029 1.7185 1.7295 1.6155
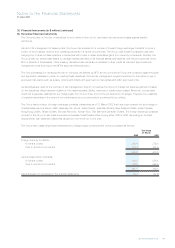
R1 Distributable reserves were restated for 2000-01 and prior years to comply with Statement of Accounting Standard (SAS) 31 Provisions, Contingent
Liabilities and Contingent Assets which became effective for financial year commencing on or after 1 October 2000. Accordingly, the proposed final
dividend less tax (previously shown under current liabilities) was added back to distributable reserves since it is no longer recognised as a liability at balance
sheet date under SAS 31.
R2 Deferred taxation was restated for 2000-01 and prior years to comply with SAS 12 (2001) Income Taxes which requires full provision for deferred tax liability.
Accordingly, a cumulative amount of $1,800 million previously retained in a special non-distributable reserve to meet deferred tax liabilities that were not
provided for in previous financial years was transferred to deferred taxation account.
R3 Internally generated cash flow comprises cash generated from operations, dividends from associated companies, and proceeds from sale of aircraft and other
fixed assets.
R4 Cash earnings is defined as profit after tax and minority interests plus depreciation.
R5 SIA local share and SIA Foreign share were merged (following approval of the merger by shareholders at the Company’s extraordinary general meeting) on
11 September 1999. For comparison, the share prices for 1997-98 and 1998-99 were that of SIA foreign share.
R6 Including 4.0 cents per share tax-exempt dividend.
R7 Including 4.75 cents per share tax-exempt dividend.
R8 Including 1.0 cent per share tax-exempt dividend.
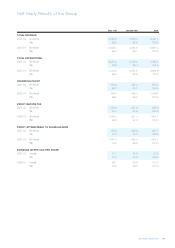
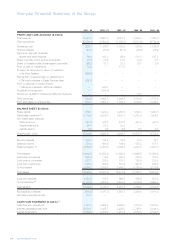
Five-year Financial Summary of the Group
SIA Annual Report 01/02 105
2001 - 02 2000 - 01 1999 - 00 1998 - 99 1997 - 98
PER SHARE DATA
Earnings before tax (cents) 76.0 155.5 115.0 87.1 91.4
Earnings after tax (cents) – basic 51.9 132.7 91.4 80.6 80.7
– diluted 51.9 132.6 91.4 80.6 80.7
Cash earnings ($) R4 1.31 2.26 1.86 1.72 1.64
Net tangible assets ($) 8.08 8.19 7.41 8.23 7.58
SHARE PRICE R5
High 14.90 19.20 20.80 13.60 13.90
Low 7.00 12.90 12.40 6.40 9.20
Closing 14.40 13.60 16.00 12.50 11.50
DIVIDENDS
Gross dividends (cents per share) 15.0 R6 35.0 30.0 R7 25.0 R8 22.5
Dividend cover (times) 4.1 5.1 3.9 4.3 4.8
PROFITABILITY RATIOS (%)
Return on shareholders’ funds 6.4 16.9 11.7 10.2 10.9
Return on total assets 3.8 9.7 7.0 6.3 6.9
Return on turnover 7.3 16.7 12.9 13.1 13.3
PRODUCTIVITY AND EMPLOYEE DATA
Value added ($ million) 2,718.2 5,180.7 4,551.5 4,097.6 4,108.4
Value added per employee ($) 126,832 182,831 165,431 146,836 146,917
Revenue per employee ($) 322,275 351,189 327,801 282,943 279,710
Average employee strength 29,316 28,336 27,513 27,906 27,964
US$/S$ exchange rate as at 31 March 1.8405 1.8029 1.7185 1.7295 1.6155
R1 Distributable reserves were restated for 2000-01 and prior years to comply with Statement of Accounting Standard (SAS) 10 (2000) Events after the Balance
Sheet Date. Accordingly, the proposed final dividend less tax (previously shown under current liabilities) was added back to distributable reserves since it is no
longer recognised as a liability at balance sheet date under SAS 10.
R2 Deferred taxation was restated for 2000-01 and prior years to comply with SAS 12 (2001) Income Taxes which requires full provision for deferred tax liability.
Accordingly, a cumulative amount of $1,800 million previously retained in a special non-distributable reserve to meet deferred tax liabilities that were not
provided for in previous financial years was transferred to deferred taxation account.
R3 Internally generated cash flow comprises cash generated from operations, dividends from associated companies, and proceeds from sale of aircraft and other
fixed assets.
R4 Cash earnings is defined as profit after tax and minority interests plus depreciation.
R5 SIA local share and SIA foreign share were merged (following approval of the merger by shareholders at the Company’s extraordinary general meeting) on
11 September 1999. For comparison, the share prices for 1997-98 and 1998-99 were that of SIA foreign share.
R6 Including 4.0 cents per share tax-exempt dividend.
R7 Including 4.75 cents per share tax-exempt dividend.
R8 Including 1.0 cent per share tax-exempt dividend.