Singapore Airlines 2002 Annual Report Download - page 49
Download and view the complete annual report
Please find page 49 of the 2002 Singapore Airlines annual report below. You can navigate through the pages in the report by either clicking on the pages listed below, or by using the keyword search tool below to find specific information within the annual report.-
 1
1 -
2
-
3
-
4
-
5
-
6
-
7
-
8
-
9
-
10
-
11
-
12
-
13
-
14
-
15
-
16
-
17
-
18
-
19
-
20
-
21
-
22
-
23
-
24
-
25
-
26
-
27
-
28
-
29
-
30
-
31
-
32
-
33
-
34
-
35
-
36
-
37
-
38
-
 39
39 -
 40
40 -
 41
41 -
 42
42 -
 43
43 -
 44
44 -
 45
45 -
 46
46 -
 47
47 -
 48
48 -
 49
49 -
 50
50 -
 51
51 -
 52
52 -
 53
53 -
 54
54 -
 55
55 -
 56
56 -
 57
57 -
 58
58 -
 59
59 -
60
-
61
-
62
-
63
-
64
-
65
-
66
-
67
-
68
-
69
-
70
-
71
-
72
-
73
-
74
-
75
-
76
-
77
-
78
-
79
-
80
-
81
-
82
-
83
-
84
-
85
-
86
-
87
-
88
-
89
-
90
-
91
-
92
-
93
-
94
-
95
-
96
-
97
-
98
-
99
-
100
-
101
-
102
-
103
-
104
-
105
-
106
-
107
-
108
-
109
-
110
-
111
-
112
-
113
-
114
-
115
-
116
 |
 |

SIA Annual Report 01/02 49
Financial Review
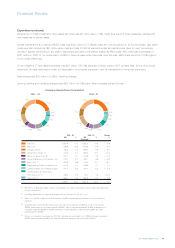
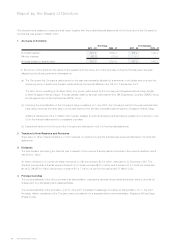
Staff Strength and Productivity
In 2001-02, the Company average staff strength was 14,499, an increase of 539 (+3.9%) over the previous year (after adjusting for last
year’s staff strength engaged in Cargo operations). The distribution of employee strength by category and location is as follows:
2000 - 01
2001 - 02 Restated % Change
Category
Senior staff (administrative and higher ranking officers) 1,388 1,248 + 11.2
Technical crew 1,710 1,588 + 7.7
Cabin crew 6,721 6,435 + 4.4
Other ground staff 4,680 4,689 - 0.2
14,499 13,960 + 3.9
Location
Singapore 11,681 11,178 + 4.5
Africa and rest of Asia 1,539 1,526 + 0.9
Europe 570 555 + 2.7
South West Pacific 405 396 + 2.3
Americas 304 305 –0.3
14,499 13,960 + 3.9
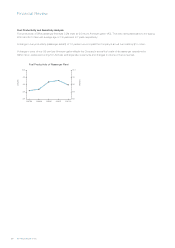
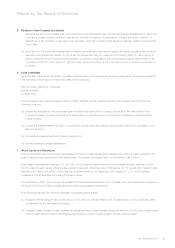
The Company’s staff productivity, measured by the average of changes in seat capacity produced, passenger load carried, revenue
earned, and value added per employee, decreased 12.4% over 2000-01 as shown below:
2000 - 01
2001 - 02 Restated % Change
Seat capacity per employee (seat-km) R1 6,656,705 6,774,495 –1.7
Passenger load carried per employee (tonne-km) R1 471,300 498,516 –5.5
Revenue per employee ($) 535,554 592,077 –9.5
Value added per employee ($) 185,958 277,407 –33.0
Average productivity decrease –12.4
R1 Based on average staff strength of passenger operations. Passenger load includes excess baggage carried.
In 2001-02, average staff strength of subsidiary companies was 15,111, up 451 (+3.1%). Head count increased in SIAEC Group (+256),
SATS Group (+80) and Singapore Airlines Cargo (+54).
The Group’s staff strength rose by 980 (+3.5%) to 29,316 employees. A breakdown is as follows:
2001 - 02 2000 - 01 % Change
SIA Passenger Airline Company 14,205 13,676 + 3.9
Singapore Airlines Cargo 632 578 + 9.3
SATS Group 9,227 9,147 + 0.9
SIA Engineering Group 4,293 4,037 + 6.3
SilkAir 516 476 + 8.4
Others 443 422 + 5.0
29,316 28,336 + 3.5
Group revenue per employee was $322,275, down 8.2%, while value added dropped 30.6% to $126,832.