Singapore Airlines 2002 Annual Report Download - page 72
Download and view the complete annual report
Please find page 72 of the 2002 Singapore Airlines annual report below. You can navigate through the pages in the report by either clicking on the pages listed below, or by using the keyword search tool below to find specific information within the annual report.-
 1
1 -
2
-
3
-
4
-
5
-
6
-
7
-
8
-
9
-
10
-
11
-
12
-
13
-
14
-
15
-
16
-
17
-
18
-
19
-
20
-
21
-
22
-
23
-
24
-
25
-
26
-
27
-
28
-
29
-
30
-
31
-
32
-
33
-
34
-
35
-
36
-
37
-
38
-
39
-
40
-
41
-
42
-
43
-
44
-
45
-
46
-
47
-
48
-
49
-
50
-
51
-
52
-
53
-
54
-
55
-
56
-
57
-
58
-
59
-
60
-
61
-
 62
62 -
 63
63 -
 64
64 -
 65
65 -
 66
66 -
 67
67 -
 68
68 -
 69
69 -
 70
70 -
 71
71 -
 72
72 -
 73
73 -
 74
74 -
 75
75 -
 76
76 -
 77
77 -
 78
78 -
 79
79 -
 80
80 -
 81
81 -
 82
82 -
83
-
84
-
85
-
86
-
87
-
88
-
89
-
90
-
91
-
92
-
93
-
94
-
95
-
96
-
97
-
98
-
99
-
100
-
101
-
102
-
103
-
104
-
105
-
106
-
107
-
108
-
109
-
110
-
111
-
112
-
113
-
114
-
115
-
116
 |
 |
Notes to the Financial Statements
31 March 2002
SIA Annual Report 01/0272
Engineering services
2001 - 02 2000 - 01
Airport terminal services
2001 - 02 2000 - 01
Airline operations
2001 - 02 2000 - 01
2002 2001 2002 2001 2002 2001
2001 - 02 2000 - 01 2001 - 02 2000 - 01 2001 - 02 2000 - 01
* Relates to inter-segment transactions eliminated on consolidation.
# Relates to the recognition of deferred gain on divestment of 51% equity interest in Eagle Services Asia.
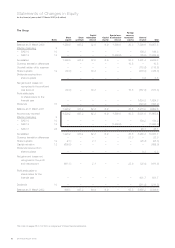
4 Segment Information (in $ million) (continued)
Business segments
TOTAL REVENUE
External revenue 8,825.3 9,326.4 375.8 372.5 145.9 131.6
Inter-segment revenue 62.0 81.6 526.4 519.5 704.7 542.2
8,887.3 9,408.0 902.2 892.0 850.6 673.8
RESULT
Segment result 442.2 934.9 265.0 193.2 210.1 125.2
Surplus on disposal of aircraft,
spares and spare engines 65.0 180.6 ––––
Dividends from subsidiary and
associated companies 138.8 67.8 ––––
Share of profits of joint venture
companies 24.2 26.3 – – (3.7) 0.7
Share of (losses)/profits of
associated companies (134.8) 60.7 22.5 17.7 46.1 3.3
Exceptional items (236.7) 442.8 ––––
Taxation (159.6) (199.7) (74.7) (40.3) (29.3) (13.4)
Profit after taxation 139.1 1,513.4 212.8 170.6 223.2 115.8
OTHER INFORMATION
AT 31 MARCH
Segment assets 15,499.4 14,700.9 1,287.7 1,174.5 651.7 523.7
Investment in equity method
joint venture and associated
companies 278.6 668.7 131.1 80.4 257.2 208.1
Tax prepayments 346.5 455.6 ––––
Total assets 16,124.5 15,825.2 1,418.8 1,254.9 908.9 731.8
Segment liabilities 5,176.2 4,138.6 325.2 403.2 182.7 240.2
Tax liabilities 2,596.8 2,557.8 162.9 113.1 41.6 23.0
Total liabilities 7,773.0 6,696.4 488.1 516.3 224.3 263.2
Capital expenditure 3,733.9 2,437.6 80.7 126.1 47.2 20.2
Depreciation 888.7 1,082.0 56.8 40.0 21.2 20.8
Impairment 1.7 9.0 ––––
Non-cash expenses other than
depreciation 115.5 (184.8) 0.4 (2.0) 1.1 (0.9)