Singapore Airlines 2002 Annual Report Download - page 4
Download and view the complete annual report
Please find page 4 of the 2002 Singapore Airlines annual report below. You can navigate through the pages in the report by either clicking on the pages listed below, or by using the keyword search tool below to find specific information within the annual report.-
 1
1 -
 2
2 -
 3
3 -
 4
4 -
 5
5 -
 6
6 -
 7
7 -
 8
8 -
 9
9 -
 10
10 -
 11
11 -
 12
12 -
 13
13 -
 14
14 -
 15
15 -
16
-
17
-
18
-
19
-
20
-
21
-
22
-
23
-
24
-
25
-
26
-
27
-
28
-
29
-
30
-
31
-
32
-
33
-
34
-
35
-
36
-
37
-
38
-
39
-
40
-
41
-
42
-
43
-
44
-
45
-
46
-
47
-
48
-
49
-
50
-
51
-
52
-
53
-
54
-
55
-
56
-
57
-
58
-
59
-
60
-
61
-
62
-
63
-
64
-
65
-
66
-
67
-
68
-
69
-
70
-
71
-
72
-
73
-
74
-
75
-
76
-
77
-
78
-
79
-
80
-
81
-
82
-
83
-
84
-
85
-
86
-
87
-
88
-
89
-
90
-
91
-
92
-
93
-
94
-
95
-
96
-
97
-
98
-
99
-
100
-
101
-
102
-
103
-
104
-
105
-
106
-
107
-
108
-
109
-
110
-
111
-
112
-
113
-
114
-
115
-
116
 |
 |

2 SIA Annual Report 01/02
Statistical Highlights
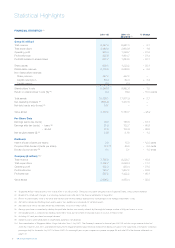
FINANCIAL STATISTICS R1
2001 - 02 2000 - 01 % Change
(Restated) R2
Group ($ million)
Total revenue 9,447.8 9,951.3 – 5.1
Total expenditure 8,464.4 8,604.6 – 1.6
Operating profit 983.4 1,346.7 – 27.0
Profit before tax 925.6 1,904.7 – 51.4
Profit attributable to shareholders 631.7 1,624.8 – 61.1
Share capital 609.1 1,220.2 – 50.1
Distributable reserves 8,719.0 8,256.0 + 5.6
Non-distributable reserves:
Share premium 447.2 447.2 –
Capital redemption 64.4 62.3 + 3.4
Capital reserve 6.9 6.9 –
Shareholders’ funds 9,846.6 9,992.6 – 1.5
Return on shareholders’ funds (%) R3 6.4 16.9 – 10.5 points
Total assets 18,580.1 17,911.9 + 3.7
Net (debt)/liquid assets R4 (656.4) 1,417.8 –
Net debt equity ratio (times) R5 0.07 – –
Value added 3,718.2 5,180.7 – 28.2
Per Share Data
Earnings before tax (cents) 76.0 155.5 – 51.1
Earnings after tax (cents) – basic R6 51.9 132.7 – 60.9
– diluted 51.9 132.6 – 60.9
Net tangible assets ($) R7 8.08 8.19 – 1.3
Dividends
Interim dividend (cents per share) 3.0 15.0 – 12.0 cents
Proposed final dividend (cents per share) 12.0 R8 20.0 – 8.0 cents
Dividend cover (times) R9 4.1 5.1 – 1.0 times
Company ($ million) R10
Total revenue 7,765.0 9,229.7 – 15.9
Total expenditure 7,282.7 8,246.4 – 11.7
Operating profit 482.3 983.4 – 51.0
Profit before tax 740.7 1,607.2 – 53.9
Profit after tax 567.2 1,422.2 – 60.1
Value added 2,696.2 4,053.4 – 33.5
R1 Singapore Airlines' financial year is from 1 April 2001 to 31 March 2002. Throughout this report all figures are in Singapore Dollars, unless stated otherwise.
R2 Restated to comply with changes in accounting standards (see note 2(a) to the financial statements on page 65 ).
R3 Return on shareholders' funds is the profit after taxation and minority interests expressed as a percentage of the average shareholders' funds.
R4 Net debt is derived by offsetting liquid assets against loan liabilities and conversely for net liquid assets.
R5 Net debt equity ratio is net debt divided by shareholders’ funds at 31 March 2002.
R6 Earnings per share is computed by dividing the profit after taxation and minority interests by the weighted average number of fully paid shares in issue.
R7 Net tangible assets is computed by dividing shareholders’ funds by the number of fully paid shares in issue at 31 March 2002.
R8 Including 4.0 cents per share tax-exempt dividend.
R9 Dividend cover is profit attributable to shareholders divided by net dividends.
R10 The corporatization of Singapore Airlines Cargo took effect from 1 July 2001. The Company’s revenue for financial year 2001-02 includes cargo revenue for the first
3 months of April to June 2001, and bellyhold revenue from Singapore Airlines Cargo (revenue received from leasing out space in the cargo holds of the parent company’s
passenger fleet) for the period July 2001 to March 2002. For meaningful year-on-year comparisons, please see page 35 and note 35 to the financial statements on
page 100.