Singapore Airlines 2002 Annual Report Download - page 43
Download and view the complete annual report
Please find page 43 of the 2002 Singapore Airlines annual report below. You can navigate through the pages in the report by either clicking on the pages listed below, or by using the keyword search tool below to find specific information within the annual report.-
 1
1 -
2
-
3
-
4
-
5
-
6
-
7
-
8
-
9
-
10
-
11
-
12
-
13
-
14
-
15
-
16
-
17
-
18
-
19
-
20
-
21
-
22
-
23
-
24
-
25
-
26
-
27
-
28
-
29
-
30
-
31
-
32
-
 33
33 -
 34
34 -
 35
35 -
 36
36 -
 37
37 -
 38
38 -
 39
39 -
 40
40 -
 41
41 -
 42
42 -
 43
43 -
 44
44 -
 45
45 -
 46
46 -
 47
47 -
 48
48 -
 49
49 -
 50
50 -
 51
51 -
 52
52 -
 53
53 -
54
-
55
-
56
-
57
-
58
-
59
-
60
-
61
-
62
-
63
-
64
-
65
-
66
-
67
-
68
-
69
-
70
-
71
-
72
-
73
-
74
-
75
-
76
-
77
-
78
-
79
-
80
-
81
-
82
-
83
-
84
-
85
-
86
-
87
-
88
-
89
-
90
-
91
-
92
-
93
-
94
-
95
-
96
-
97
-
98
-
99
-
100
-
101
-
102
-
103
-
104
-
105
-
106
-
107
-
108
-
109
-
110
-
111
-
112
-
113
-
114
-
115
-
116
 |
 |

Financial Review
SIA Annual Report 01/02 43
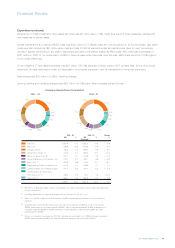
2,500
2,000
1,500
1,000
500
0
Passenger Revenue Composition by Routes
$ Million
$ Million
2,500
2,000
1,500
1,000
500
0
East Asia
Americas
Europe
South West Pacific
West Asia and Africa
2001/02 2000/01
33.6%
20.5% 20.1%
15.6%
10.2%
33.4%
22.5%
18.7%
14.6%
10.8%
4,000
3,000
2,000
1,000
0
Passenger Revenue Composition
by Area of Original Sale
$ Million
$ Million
4,000
3,000
2,000
1,000
0
East Asia
Europe
South West Pacific
Americas
West Asia and Africa
2001/02 2000/01
51.2%
19.6%
11.9% 9.7% 7.6%
53.0%
17.8%
10.9% 10.4% 7.9%
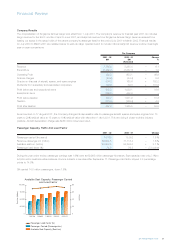
Company Route Performance
A review of the Company’s passenger route performance is shown below:
Passenger Revenue R1 By Route Region R3
by Area of Original Sale R2 Passenger Revenue Passenger Load Factor
$M $M %
2001 - 02 2000 - 01 2001 - 02 2000 - 01 2001 - 02 2000 - 01
East Asia 3,234.1 3,549.6 2,124.8 2,240.0 71.2 72.8
Americas 613.8 696.5 1,296.0 1,505.1 69.1 79.4
Europe 1,241.3 1,195.6 1,274.2 1,253.4 80.1 78.8
South West Pacific 754.9 728.2 986.4 976.7 80.4 77.0
West Asia and Africa 482.2 530.8 644.9 725.5 67.4 74.7
Systemwide 6,326.3 6,700.7 6,326.3 6,700.7 74.0 76.8
R1 Includes excess baggage revenue
R2 Passenger revenue by area of original sale is defined as revenue originating in the area in which the sale is made. East Asia covers mainly Brunei, Hong Kong,
Indonesia, Japan, Korea, Macau, Malaysia, People’s Republic of China, Philippines, Singapore, Thailand, Taiwan and Vietnam. Americas comprises mainly
Canada, Latin America and USA. Europe consists mainly of Baltic States, Continental Europe, Russia, Scandinavia and United Kingdom. South West Pacific
includes largely Australia and New Zealand. West Asia and Africa are mainly made up of Bangladesh, India, Mauritius, Middle East, Pakistan, South Africa
and Turkey.
R3 Passenger revenue by route region is defined as revenue derived from a route originating from Singapore with its final destination in countries covered by the
region and vice versa. For example, revenue from SIN-HKG-SFO-HKG-SIN route is classified under Americas region.