Singapore Airlines 2002 Annual Report Download - page 91
Download and view the complete annual report
Please find page 91 of the 2002 Singapore Airlines annual report below. You can navigate through the pages in the report by either clicking on the pages listed below, or by using the keyword search tool below to find specific information within the annual report.-
 1
1 -
2
-
3
-
4
-
5
-
6
-
7
-
8
-
9
-
10
-
11
-
12
-
13
-
14
-
15
-
16
-
17
-
18
-
19
-
20
-
21
-
22
-
23
-
24
-
25
-
26
-
27
-
28
-
29
-
30
-
31
-
32
-
33
-
34
-
35
-
36
-
37
-
38
-
39
-
40
-
41
-
42
-
43
-
44
-
45
-
46
-
47
-
48
-
49
-
50
-
51
-
52
-
53
-
54
-
55
-
56
-
57
-
58
-
59
-
60
-
61
-
62
-
63
-
64
-
65
-
66
-
67
-
68
-
69
-
70
-
71
-
72
-
73
-
74
-
75
-
76
-
77
-
78
-
79
-
80
-
 81
81 -
 82
82 -
 83
83 -
 84
84 -
 85
85 -
 86
86 -
 87
87 -
 88
88 -
 89
89 -
 90
90 -
 91
91 -
 92
92 -
 93
93 -
 94
94 -
 95
95 -
 96
96 -
 97
97 -
 98
98 -
 99
99 -
 100
100 -
 101
101 -
102
-
103
-
104
-
105
-
106
-
107
-
108
-
109
-
110
-
111
-
112
-
113
-
114
-
115
-
116
 |
 |

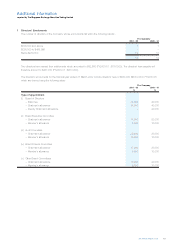
SIA Annual Report 01/02 91
Notes to the Financial Statements
31 March 2002
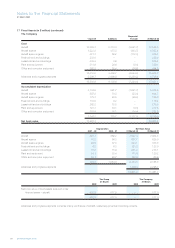
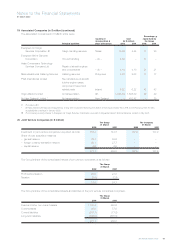
22 Trade Debtors (in $ million)
Trade debtors are stated after deducting provision for doubtful debts. An analysis of the provision for doubtful debts is as follows:-
The Group The Company
31 March 31 March
2002 2001 2002 2001
Balance at 1 April 91.7 111.9 59.8 56.4
(Write-back)/charged to profit and loss account (6.9) (20.2) 0.5 3.4
Balance at 31 March 84.8 91.7 60.3 59.8
Bad debts (recovered)/written-off directly to
profit and loss account – (5.8) 0.9 1.1
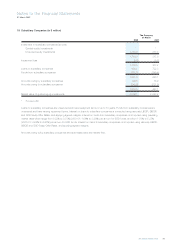
Loans to directors of the Company and its subsidiary companies in accordance with schemes approved by shareholders of the
Company amounted to $0.9 million (2001: $0.9 million).
23 Stocks (in $ million)
The Group The Company
31 March 31 March
2002 2001 2002 2001
Technical stocks and stores 20.4 16.2 7.1 6.3
Catering and general stocks 29.7 30.1 22.5 20.2
Work-in-progress 16.9 8.1 – –
67.0 54.4 29.6 26.5
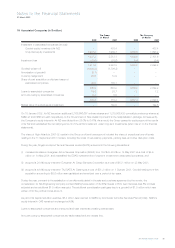
24 Investments (in $ million)
The Group The Company
31 March 31 March
2002 2001 2002 2001
Quoted at cost
Government securities 2.4 247.2 – –
Equity investments 18.9 18.0 – –
Non-equity investments 13.6 248.0 – –
34.9 513.2 – –
(Write-down)/write-back of diminution in value
Government securities – (2.7) – –
Equity investments – (0.7) – –
Non-equity investments (0.7) 1.6 – –
(0.7) (1.8) – –
34.2 511.4 – –
Market value of quoted investments
Government securities 2.4 244.5 – –
Equity investments 21.9 17.4 – –
Non-equity investments 13.1 249.9 – –
37.4 511.8 – –
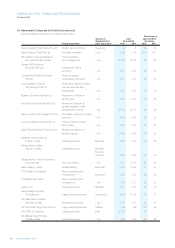
25 Cash and Bank Balances (in $ million)
The Group The Company
31 March 31 March
2002 2001 2002 2001
Fixed deposits 531.5 1,136.1 438.0 760.4
Cash on hand and in banks 560.1 136.2 416.9 106.6
1,091.6 1,272.3 854.9 867.0