Singapore Airlines 2002 Annual Report Download - page 34
Download and view the complete annual report
Please find page 34 of the 2002 Singapore Airlines annual report below. You can navigate through the pages in the report by either clicking on the pages listed below, or by using the keyword search tool below to find specific information within the annual report.-
 1
1 -
2
-
3
-
4
-
5
-
6
-
7
-
8
-
9
-
10
-
11
-
12
-
13
-
14
-
15
-
16
-
17
-
18
-
19
-
20
-
21
-
22
-
23
-
 24
24 -
 25
25 -
 26
26 -
 27
27 -
 28
28 -
 29
29 -
 30
30 -
 31
31 -
 32
32 -
 33
33 -
 34
34 -
 35
35 -
 36
36 -
 37
37 -
 38
38 -
 39
39 -
 40
40 -
 41
41 -
 42
42 -
 43
43 -
 44
44 -
45
-
46
-
47
-
48
-
49
-
50
-
51
-
52
-
53
-
54
-
55
-
56
-
57
-
58
-
59
-
60
-
61
-
62
-
63
-
64
-
65
-
66
-
67
-
68
-
69
-
70
-
71
-
72
-
73
-
74
-
75
-
76
-
77
-
78
-
79
-
80
-
81
-
82
-
83
-
84
-
85
-
86
-
87
-
88
-
89
-
90
-
91
-
92
-
93
-
94
-
95
-
96
-
97
-
98
-
99
-
100
-
101
-
102
-
103
-
104
-
105
-
106
-
107
-
108
-
109
-
110
-
111
-
112
-
113
-
114
-
115
-
116
 |
 |

Financial Review
SIA Annual Report 01/02
34
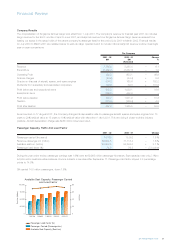
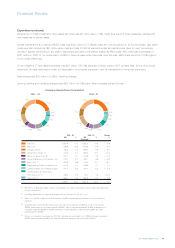
Group Profitability Ratios
Cents
Percent
1997/98 1998/99 1999/00 2000/01 2001/02
Earnings per share (¢)
Return on Turnover (%)
Return on Shareholders' Funds (%)
Return on Total Assets (%)
25
20
15
10
5
0
140
105
70
35
0
Group Earnings (continued)
A deferred gain of $203 million on divestment (in June 1998) of SIAEC’s 51.0% equity interests in Eagle Services Asia (ESA) was
recognised. Although the gain was earned four years ago, it could not be recognised earlier because Pratt & Whitney held an option to
sell their shares in ESA back to SIA under certain conditions. Agreement has just been achieved with Pratt & Whitney that, among other
things, removed this option. With this put option removed, SIA is now allowed by the auditors to recognize the gain.
The sale of the remaining shareholding in Equant N.V. yielded a profit of $30 million.
Profit attributable to shareholders at $632 million was 61.1% lower (–$993 million). The Group’s profit before tax and exceptional items
was $960 million, a 40.0% drop (–$640 million) against last year’s $1,599 million.
The Group’s basic earnings per share (based on weighted average number of fully paid shares in issue after accounting for share
buyback and cancellation of 2,054,000 shares since 1 April 2001) decreased 60.9% (–80.8 cents) to 51.9 cents.
The Group’s net tangible assets per share dropped 1.3% (–$0.11) from $8.19 (restated) a year ago to $8.08 at 31 March 2002, after
accounting for share buyback costing $25 million and capital distribution of $609 million.
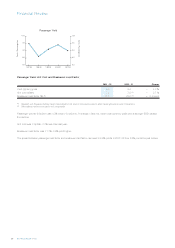
The Group profitability ratios are as follows:
2001 - 02 2000 - 01 Change
% % % pts
Return on turnover 7.3 16.7 –9.4
Return on total assets 3.8 9.7 –5.9
Return on average shareholders’ funds 6.4 16.9 –10.5
If exceptional items were excluded, returns would be higher at 7.7% (turnover), 4.0% (total assets), and 6.8% (average shareholders’ funds).