Singapore Airlines 2002 Annual Report Download - page 71
Download and view the complete annual report
Please find page 71 of the 2002 Singapore Airlines annual report below. You can navigate through the pages in the report by either clicking on the pages listed below, or by using the keyword search tool below to find specific information within the annual report.-
 1
1 -
2
-
3
-
4
-
5
-
6
-
7
-
8
-
9
-
10
-
11
-
12
-
13
-
14
-
15
-
16
-
17
-
18
-
19
-
20
-
21
-
22
-
23
-
24
-
25
-
26
-
27
-
28
-
29
-
30
-
31
-
32
-
33
-
34
-
35
-
36
-
37
-
38
-
39
-
40
-
41
-
42
-
43
-
44
-
45
-
46
-
47
-
48
-
49
-
50
-
51
-
52
-
53
-
54
-
55
-
56
-
57
-
58
-
59
-
60
-
 61
61 -
 62
62 -
 63
63 -
 64
64 -
 65
65 -
 66
66 -
 67
67 -
 68
68 -
 69
69 -
 70
70 -
 71
71 -
 72
72 -
 73
73 -
 74
74 -
 75
75 -
 76
76 -
 77
77 -
 78
78 -
 79
79 -
 80
80 -
 81
81 -
82
-
83
-
84
-
85
-
86
-
87
-
88
-
89
-
90
-
91
-
92
-
93
-
94
-
95
-
96
-
97
-
98
-
99
-
100
-
101
-
102
-
103
-
104
-
105
-
106
-
107
-
108
-
109
-
110
-
111
-
112
-
113
-
114
-
115
-
116
 |
 |

Notes to the Financial Statements
31 March 2002
SIA Annual Report 01/02 71
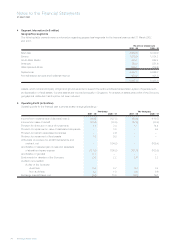
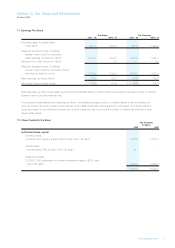
3 Other Income (in $ million)
The Group The Company
2001 - 02 2000 - 01 2001 - 02 2000 - 01
Fixed deposits 29.5 55.9 26.1 51.3
Quoted non-equity investments 19.9 55.8 14.6 21.8
Quoted equity investments 2.0 4.7 1.6 1.4
Unquoted trade investments 4.1 6.2 3.1 5.4
Unquoted non-equity investments 4.9 2.0 3.0 4.8
Interest receivable from subsidiary companies – – 14.4 25.1
Interest receivable from other loans 3.6 2.0 2.8 0.9
Interest receivable from associated companies 0.6 0.9 – –
Income from investments and deposits 64.6 127.5 65.6 110.7
Surplus on sale of fixed assets other than aircraft
and spares 2.9 2.4 0.1 2.2
Surplus/(Loss) on sale of investments 8.0 (1.6) 4.6 0.1
75.5 128.3 70.3 113.0
4 Segment Information (in $ million)
Revenue earned is generated principally from the carriage of passengers, cargo and mail, the rendering of airport terminal services,
engineering services, air charters and tour wholesaling and related activities. It excludes dividends from subsidiary companies, and in
respect of the Group, inter-company transactions.
The Group The Company
2001 - 02 2000 - 01 2001 - 02 2000 - 01
External customers 9,447.8 9,951.3 7,110.6 9,149.6
Subsidiary companies – – 654.4 80.1
9,447.8 9,951.3 7,765.0 9,229.7
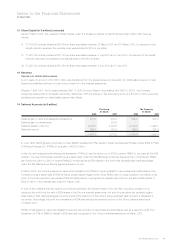
The Group’s business is organized and managed separately accordingly to the nature of the services provided. Revenues are
attributable to geographical areas based on the airline operations by area of original sale.
The following tables present revenue and profit information regarding business segments for the financial years ended 31 March 2002
and 2001 and certain assets and liabilities information of the business segments as at those dates.