Singapore Airlines 2002 Annual Report Download - page 44
Download and view the complete annual report
Please find page 44 of the 2002 Singapore Airlines annual report below. You can navigate through the pages in the report by either clicking on the pages listed below, or by using the keyword search tool below to find specific information within the annual report.-
 1
1 -
2
-
3
-
4
-
5
-
6
-
7
-
8
-
9
-
10
-
11
-
12
-
13
-
14
-
15
-
16
-
17
-
18
-
19
-
20
-
21
-
22
-
23
-
24
-
25
-
26
-
27
-
28
-
29
-
30
-
31
-
32
-
33
-
 34
34 -
 35
35 -
 36
36 -
 37
37 -
 38
38 -
 39
39 -
 40
40 -
 41
41 -
 42
42 -
 43
43 -
 44
44 -
 45
45 -
 46
46 -
 47
47 -
 48
48 -
 49
49 -
 50
50 -
 51
51 -
 52
52 -
 53
53 -
 54
54 -
55
-
56
-
57
-
58
-
59
-
60
-
61
-
62
-
63
-
64
-
65
-
66
-
67
-
68
-
69
-
70
-
71
-
72
-
73
-
74
-
75
-
76
-
77
-
78
-
79
-
80
-
81
-
82
-
83
-
84
-
85
-
86
-
87
-
88
-
89
-
90
-
91
-
92
-
93
-
94
-
95
-
96
-
97
-
98
-
99
-
100
-
101
-
102
-
103
-
104
-
105
-
106
-
107
-
108
-
109
-
110
-
111
-
112
-
113
-
114
-
115
-
116
 |
 |

Financial Review
SIA Annual Report 01/02
44
100
80
60
40
20
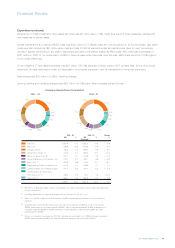
0
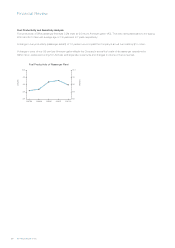
Passenger Load Factor by Routes
Percent
Percent
East Asia Americas Europe South West West Asia
Pacific and Africa
2001/02
2000/01
100
80
60
40
20
0
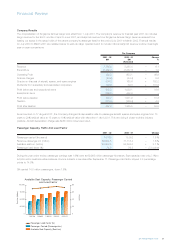
Company Route Performance (continued)
By area of original sale, countries in East Asia contributed most to systemwide passenger revenue (51.2%), followed by countries in
Europe (19.6%), South West Pacific (11.9.%), Americas (9.7%) and West Asia and Africa (7.6%).
Revenue from East Asian routes contributed 33.6%, up 0.2% point over the previous year. American routes had a 20.5% share of
passenger revenue, down 2.0% points principally because of September 11 terrorist attacks in the United States. European routes’ share
was higher by 1.4% points at 20.1%. South West Pacific routes’ contribution was 15.6%, up 1.0% point. West Asian and African routes
accounted for 10.2%, a drop of 0.6% point.
About 80% of passenger revenue collections in 2001-02 were in Singapore Dollars, United States Dollars, Japanese Yen, Taiwanese
Dollars, Hong Kong Dollars, Australian Dollars, Sterling Pounds, and Euro currencies.
East Asian Routes
Passenger revenue from East Asian routes declined 5.1% (–$115 million) to $2,125 million. Passenger carriage was unchanged
from the previous year. Seat capacity rose 2.1%. Frequencies to Osaka, Nagoya, Karachi, Taipei and Hong Kong were reduced after
September 11. Passenger load factor was 1.6% points lower at 71.2%. Yield fell 5.1% largely because of lower carriage of first and
business class passengers, reduction in fares, and the weakening of the Japanese Yen, Taiwanese Dollar and Korean Won against the
Singapore Dollar.
American Routes
American routes’ passenger revenue was 13.9% lower (–$209 million) at $1,296 million. Passenger traffic dropped 11.1% while seat
capacity increased 2.1%. A new service to Chicago which commenced on 1 August 2001 was suspended on 13 January 2002.
Passenger load factor fell 10.3% points to 69.1%. Second half passenger load factor fell 15.4% points when compared to the first half of
the same financial year as the full brunt of September 11 took its toll on demand in subsequent months. A decline in the passenger
carriage was recorded on all cabin classes. Passenger yield deteriorated 3.6%. The strengthening of the United States Dollar against the
Singapore Dollar cushioned the drop.
European Routes
Passenger revenue from European routes recorded an increase of 1.7% (+$21 million) to $1,274 million. Traffic rose 3.7%, while seat
capacity grew 2.1%. Passenger load factor was 1.3% points higher at 80.1%. Yield was down 1.4% mainly because of poorer loads on
first and business class, partially compensated by the strengthening of European currencies against the Singapore Dollar.
South West Pacific Routes
South West Pacific registered a revenue increase of 1.0% (+$10 million) to $986 million. Traffic was 6.6% higher. With a lower increase in
seat capacity at 2.1%, passenger load factor improved 3.4% points to 80.4%. Yield dropped 5.2% because of a change in fare mix and
the weakening of the Australian Dollar against the Singapore Dollar.
West Asian and African Routes
Revenue from West Asian and African routes fell 11.1% (–$81 million) to $645 million. Traffic decreased 8.0% because of September 11.
Seat capacity expanded 2.1%. Services to Karachi and Lahore were suspended during the period September 2001 to January 2002.
Passenger load factor was 7.3% points lower at 67.4%. When compared to the first half of 2001-02, second half passenger load factor
dropped 10.4% points. Yield declined 3.9% chiefly because of lower carriage of first and business class passengers and the weakening
of the South African Rand, Indian and Pakistani Rupees against the Singapore Dollar.