Singapore Airlines 2002 Annual Report Download - page 74
Download and view the complete annual report
Please find page 74 of the 2002 Singapore Airlines annual report below. You can navigate through the pages in the report by either clicking on the pages listed below, or by using the keyword search tool below to find specific information within the annual report.-
 1
1 -
2
-
3
-
4
-
5
-
6
-
7
-
8
-
9
-
10
-
11
-
12
-
13
-
14
-
15
-
16
-
17
-
18
-
19
-
20
-
21
-
22
-
23
-
24
-
25
-
26
-
27
-
28
-
29
-
30
-
31
-
32
-
33
-
34
-
35
-
36
-
37
-
38
-
39
-
40
-
41
-
42
-
43
-
44
-
45
-
46
-
47
-
48
-
49
-
50
-
51
-
52
-
53
-
54
-
55
-
56
-
57
-
58
-
59
-
60
-
61
-
62
-
63
-
 64
64 -
 65
65 -
 66
66 -
 67
67 -
 68
68 -
 69
69 -
 70
70 -
 71
71 -
 72
72 -
 73
73 -
 74
74 -
 75
75 -
 76
76 -
 77
77 -
 78
78 -
 79
79 -
 80
80 -
 81
81 -
 82
82 -
 83
83 -
 84
84 -
85
-
86
-
87
-
88
-
89
-
90
-
91
-
92
-
93
-
94
-
95
-
96
-
97
-
98
-
99
-
100
-
101
-
102
-
103
-
104
-
105
-
106
-
107
-
108
-
109
-
110
-
111
-
112
-
113
-
114
-
115
-
116
 |
 |

74
Notes to the Financial Statements
31 March 2002
SIA Annual Report 01/02
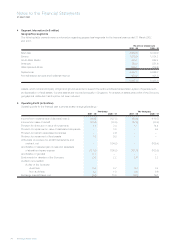
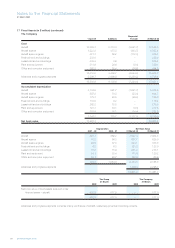
4 Segment Information (in $ million)
Geographical segments
The following table presents revenue information regarding geographical segments for the financial years ended 31 March 2002
and 2001.
By area of original sale
2001 - 02 2000 - 01
East Asia 4,589.5 5,049.9
Europe 1,578.9 1,524.2
South West Pacific 883.1 852.4
Americas 750.5 851.6
West Asia and Africa 655.1 708.6
Systemwide 8,457.1 8,986.7
Non-scheduled services and incidental revenue 430.2 421.3
8,887.3 9,408.0
Assets, which consist principally of flight and ground equipment, support the entire worldwide transportation system. Expenses such
as depreciation of fixed assets, fuel and salaries are incurred principally in Singapore. An analysis of assets and profits of the Group by
geographical distribution has therefore not been included.
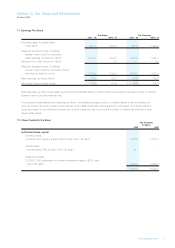
5 Operating Profit (in $ million)
Operating profit for the financial year is arrived at after charging/(crediting):-
The Group The Company
2001 - 02 2000 - 01 2001 - 02 2000 - 01
Income from investments and deposits (note 3) (64.6) (127.5) (65.6) (110.7)
Income from lease of aircraft (27.9) (33.8) (27.9) (33.8)
Provision for diminution in value of investments 1.1 3.4 1.1 14.4
Provision for impairment in value of associated companies – 3.5 – 9.4
Provision for loans to associated companies – 2.6 – –
Provision for impairment of fixed assets 1.8 9.0 – –
Write-back of provision for aircraft maintenance and
overhaul, net – (104.8) – (109.4)
Amortization of deferred gain on sale and leaseback
of aircraft and spare engines (121.2) (100.8) (121.0) (100.8)
Amortization of goodwill 5.1 – – –
Emoluments for directors of the Company 2.6 2.2 2.6 2.2
Auditors’ remuneration
Auditor of the Company
Audit fees 0.8 0.7 0.4 0.4
Non-audit fees 1.2 1.0 0.6 0.6
Exchange (gains)/losses, net (3.2) 13.5 (6.1) 19.1