Singapore Airlines 2002 Annual Report Download - page 48
Download and view the complete annual report
Please find page 48 of the 2002 Singapore Airlines annual report below. You can navigate through the pages in the report by either clicking on the pages listed below, or by using the keyword search tool below to find specific information within the annual report.-
 1
1 -
2
-
3
-
4
-
5
-
6
-
7
-
8
-
9
-
10
-
11
-
12
-
13
-
14
-
15
-
16
-
17
-
18
-
19
-
20
-
21
-
22
-
23
-
24
-
25
-
26
-
27
-
28
-
29
-
30
-
31
-
32
-
33
-
34
-
35
-
36
-
37
-
 38
38 -
 39
39 -
 40
40 -
 41
41 -
 42
42 -
 43
43 -
 44
44 -
 45
45 -
 46
46 -
 47
47 -
 48
48 -
 49
49 -
 50
50 -
 51
51 -
 52
52 -
 53
53 -
 54
54 -
 55
55 -
 56
56 -
 57
57 -
 58
58 -
59
-
60
-
61
-
62
-
63
-
64
-
65
-
66
-
67
-
68
-
69
-
70
-
71
-
72
-
73
-
74
-
75
-
76
-
77
-
78
-
79
-
80
-
81
-
82
-
83
-
84
-
85
-
86
-
87
-
88
-
89
-
90
-
91
-
92
-
93
-
94
-
95
-
96
-
97
-
98
-
99
-
100
-
101
-
102
-
103
-
104
-
105
-
106
-
107
-
108
-
109
-
110
-
111
-
112
-
113
-
114
-
115
-
116
 |
 |
Financial Review
SIA Annual Report 01/02
48
350
280
210
140
70
0
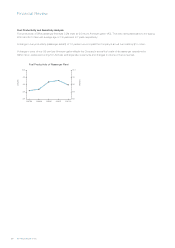
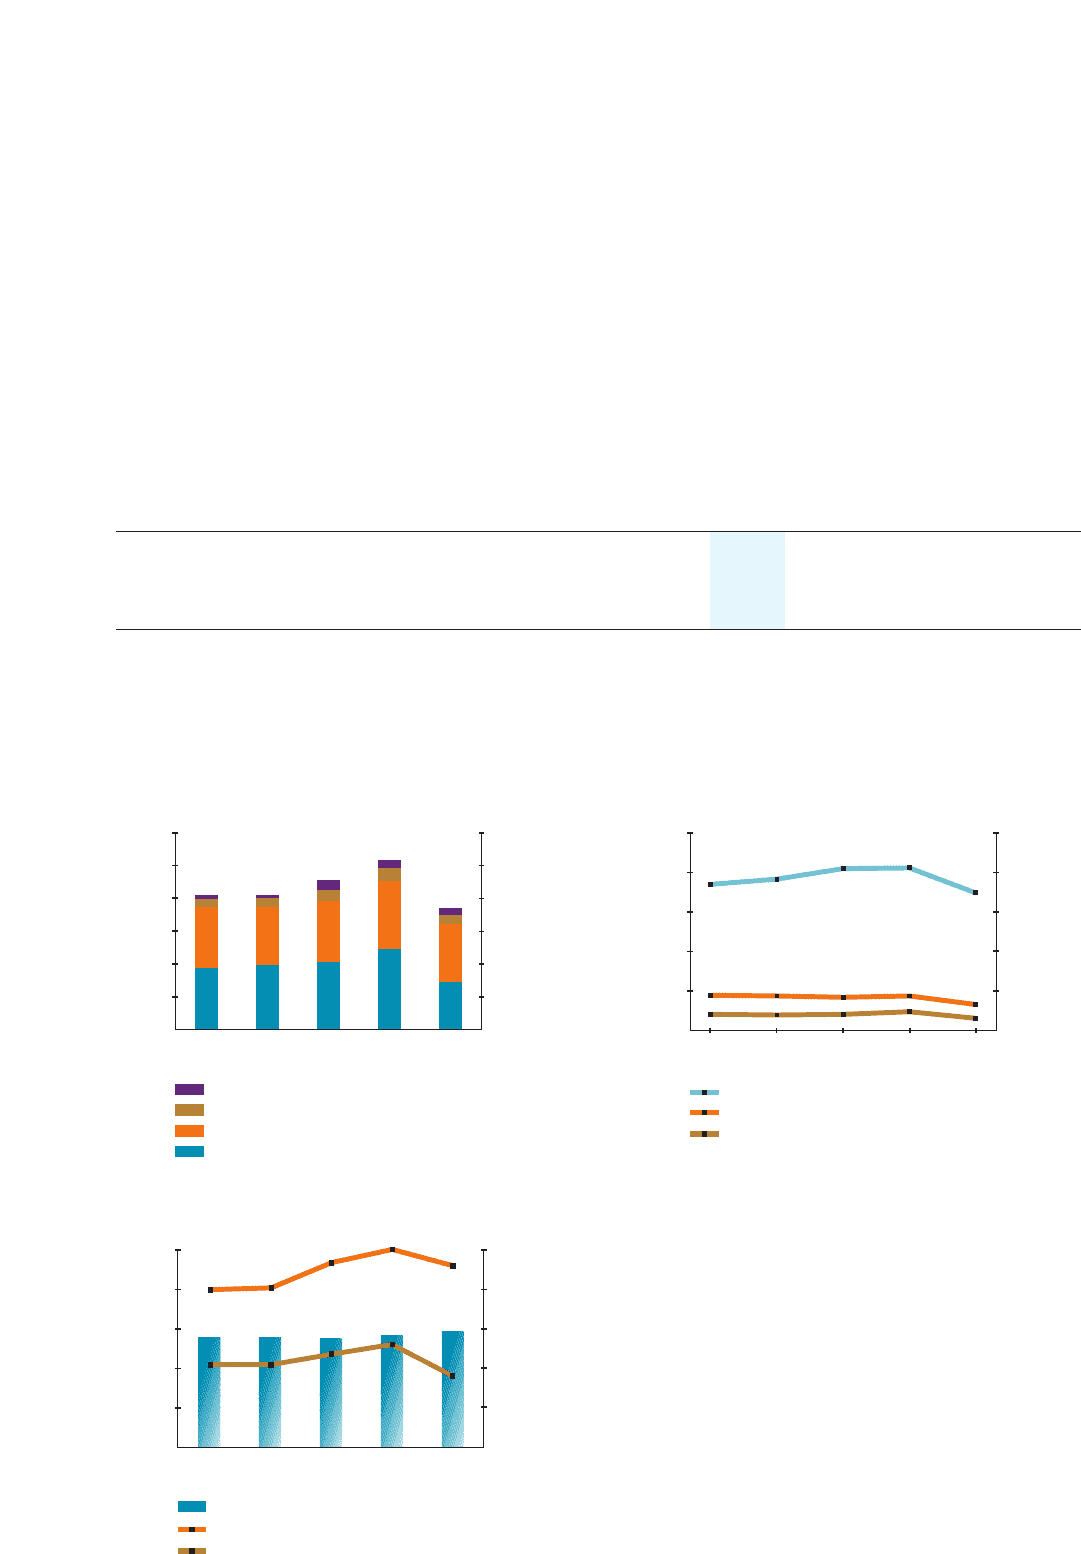
Group Staff Strength and Productivity
$ ‘000
Staff Number
Staff Strength
Revenue per Employee ($)
Value Added per Employee ($)
50,000
40,000
30,000
20,000
10,000
0
1997/98 1998/99 1999/00 2000/01 2001/02
Group Value Added
$ Million
$ Million
1997/98 1998/99 1999/00 2000/01 2001/02
Government
Suppliers of Capital
Employees
Retained in the Business
6,000
5,000
4,000
3,000
2,000
1,000
0
6,000
5,000
4,000
3,000
2,000
1,000
0
Group Value Added Productivity
Dollar
Dollar
1997/98 1998/99 1999/00 2000/01 2001/02
Value Added per $ Employment Costs
Value Added per $ Revenue
Value Added per $ Investment in Fixed Assets
3.0
2.4
1.8
1.2
0.6
0
3.0
2.4
1.8
1.2
0.6
0
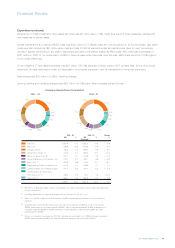
Value Added
During the year under review, total value added of the Group declined $1,463 million (–28.2%) to $3,718 million. The fall was due to:
(i) decrease in revenue (–$504 million), (ii) lower surplus on disposal of aircraft, spares and spare engines (–$115 million), (iii) share of
losses of associated companies (–$66 million) against share of profit last year (+$82 million), (iv) drop in share of profit in joint venture
companies (–$7 million), (v) provision for diminution in value of investment in Air NZ (–$267 million) and (vi) the previous year’s profit from
sale of shares in SATS and SIAEC on 5 May 2000 (–$440 million). The recognition of deferred gain on divestment of 51.0% equity
interests in ESA (+$203 million) cushioned the drop.
Salaries and other staff costs accounted for $1,779 million (47.9 %) of the value added. Another $152 million (4.1%) was applied on
dividends to shareholders and $44 million (1.2%) paid for finance charges, while minority interests’ share was $60 million (1.6%). Another
$234 million (6.3%) was for corporate taxes. The remaining $1,449 million (38.9%) was retained for future capital requirements.
Value added productivity is as follows:
2001 - 02 2000 - 01 Change
$$ %
Value added per dollar of:
Revenue earned 0.39 0.52 –25.0
Employment costs 2.09 2.47 –15.4
Investment in fixed assets 0.18 0.28 –35.7
Value added created for every dollar of revenue earned, employment costs and investment in fixed assets fell 25.0%, 15.4% and 35.7%
respectively.
The Group contributed 2.1% to Singapore’s Gross Domestic Product for calendar year 2001, 1.0% point lower than the previous year.