Singapore Airlines 2002 Annual Report Download - page 61
Download and view the complete annual report
Please find page 61 of the 2002 Singapore Airlines annual report below. You can navigate through the pages in the report by either clicking on the pages listed below, or by using the keyword search tool below to find specific information within the annual report.-
 1
1 -
2
-
3
-
4
-
5
-
6
-
7
-
8
-
9
-
10
-
11
-
12
-
13
-
14
-
15
-
16
-
17
-
18
-
19
-
20
-
21
-
22
-
23
-
24
-
25
-
26
-
27
-
28
-
29
-
30
-
31
-
32
-
33
-
34
-
35
-
36
-
37
-
38
-
39
-
40
-
41
-
42
-
43
-
44
-
45
-
46
-
47
-
48
-
49
-
50
-
 51
51 -
 52
52 -
 53
53 -
 54
54 -
 55
55 -
 56
56 -
 57
57 -
 58
58 -
 59
59 -
 60
60 -
 61
61 -
 62
62 -
 63
63 -
 64
64 -
 65
65 -
 66
66 -
 67
67 -
 68
68 -
 69
69 -
 70
70 -
 71
71 -
72
-
73
-
74
-
75
-
76
-
77
-
78
-
79
-
80
-
81
-
82
-
83
-
84
-
85
-
86
-
87
-
88
-
89
-
90
-
91
-
92
-
93
-
94
-
95
-
96
-
97
-
98
-
99
-
100
-
101
-
102
-
103
-
104
-
105
-
106
-
107
-
108
-
109
-
110
-
111
-
112
-
113
-
114
-
115
-
116
 |
 |

SIA Annual Report 01/02 61
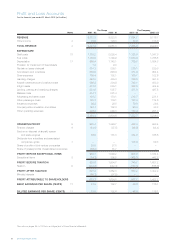
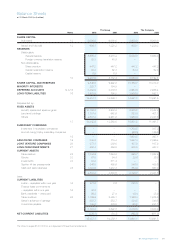
Balance Sheets
at 31 March 2002 (in $ million)
The Group The Company
Notes 2002 2001 2002 2001
SHARE CAPITAL
Authorized 12 3,000.0 6,000.0 3,000.0 6,000.0
Issued and fully paid 12 609.1 1,220.2 609.1 1,220.2
RESERVES
Distributable
General reserve 8,655.2 8,215.2 9,049.0 8,683.3
Foreign currency translation reserve 63.8 40.8 – –
Non-distributable
Share premium 447.2 447.2 447.2 447.2
Capital redemption reserve 64.4 62.3 64.4 62.3
Capital reserve 6.9 6.9 – –
13 9,237.5 8,772.4 9,560.6 9,192.8
SHARE CAPITAL AND RESERVES 9,846.6 9,992.6 10,169.7 10,413.0
MINORITY INTERESTS 228.7 184.5 – –
DEFERRED ACCOUNTS 14 & 15 3,452.9 3,316.5 2,964.6 2,986.4
LONG-TERM LIABILITIES 16 1,928.9 795.5 1,506.8 592.1
15,457.1 14,289.1 14,641.1 13,991.5
Represented by:-
FIXED ASSETS
Aircraft, spares and spare engines 10,798.3 8,938.8 8,538.2 8,582.8
Land and buildings 1,107.4 942.6 383.0 401.1
Others 2,537.2 2,981.6 1,980.0 2,477.8
17 14,442.9 12,863.0 10,901.2 11,461.7
SUBSIDIARY COMPANIES
Investment in subsidiary companies – – 1,700.5 307.2
Amount owing (to)/by subsidiary companies – – (66.0) 159.9
18 – – 1,634.5 467.1
ASSOCIATED COMPANIES 19 385.8 715.4 1,687.4 2,099.4
JOINT VENTURE COMPANIES 20 277.1 239.0 107.9 107.9
LONG-TERM INVESTMENTS 21 590.4 556.0 502.9 467.3
CURRENT ASSETS
Trade debtors 22 1,344.9 1,244.8 895.7 1,082.4
Stocks 23 67.0 54.4 29.6 26.5
Investments 24 34.2 511.4 – –
Section 44 tax prepayments 346.5 455.6 346.5 455.6
Cash and bank balances 25 1,091.6 1,272.3 854.9 867.0
2,884.2 3,538.5 2,126.7 2,431.5
Less:
CURRENT LIABILITIES
Loans – repayable within one year 16 221.6 0.6 220.0 –
Finance lease commitments
– repayable within one year 16 42.3 – – –
Bank overdrafts – unsecured 56.8 27.4 48.4 25.9
Trade creditors 26 1,769.9 2,465.1 1,166.4 1,935.9
Sales in advance of carriage 887.7 853.7 824.5 840.5
Current tax payable 145.0 276.0 60.2 241.1
3,123.3 3,622.8 2,319.5 3,043.4
NET CURRENT LIABILITIES (239.1) (84.3) (192.8) (611.9)
15,457.1 14,289.1 14,641.1 13,991.5
The notes on pages 65 to 100 form an integral part of these financial statements.