Singapore Airlines 2002 Annual Report Download - page 5
Download and view the complete annual report
Please find page 5 of the 2002 Singapore Airlines annual report below. You can navigate through the pages in the report by either clicking on the pages listed below, or by using the keyword search tool below to find specific information within the annual report.-
 1
1 -
 2
2 -
 3
3 -
 4
4 -
 5
5 -
 6
6 -
 7
7 -
 8
8 -
 9
9 -
 10
10 -
 11
11 -
 12
12 -
 13
13 -
 14
14 -
 15
15 -
 16
16 -
17
-
18
-
19
-
20
-
21
-
22
-
23
-
24
-
25
-
26
-
27
-
28
-
29
-
30
-
31
-
32
-
33
-
34
-
35
-
36
-
37
-
38
-
39
-
40
-
41
-
42
-
43
-
44
-
45
-
46
-
47
-
48
-
49
-
50
-
51
-
52
-
53
-
54
-
55
-
56
-
57
-
58
-
59
-
60
-
61
-
62
-
63
-
64
-
65
-
66
-
67
-
68
-
69
-
70
-
71
-
72
-
73
-
74
-
75
-
76
-
77
-
78
-
79
-
80
-
81
-
82
-
83
-
84
-
85
-
86
-
87
-
88
-
89
-
90
-
91
-
92
-
93
-
94
-
95
-
96
-
97
-
98
-
99
-
100
-
101
-
102
-
103
-
104
-
105
-
106
-
107
-
108
-
109
-
110
-
111
-
112
-
113
-
114
-
115
-
116
 |
 |

SIA Annual Report 01/02 3
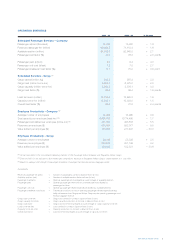
OPERATING STATISTICS
2001 - 02 2000 - 01 % Change
Scheduled Passenger Services – Company
Passenger carried (thousand) 14,765 15,002 – 1.6
Revenue passenger-km (million) 69,994.5 71,118.4 – 1.6
Available seat-km (million) 94,558.5 92,648.0 + 2.1
Passenger load factor (%) 74.0 76.8 – 2.8 points
Passenger yield (¢/pkm) 9.0 9.4 – 4.3
Passenger unit cost (¢/ask) 7.3 7.5 – 2.7
Passenger breakeven load factor (%) 71.1 70.2 + 0.9 point
Scheduled Services – Group R1
Cargo carried (million kg) 938.5 975.4 – 3.8
Cargo load (million tonne-km) 5,954.3 6,075.2 – 2.0
Cargo capacity (million tonne-km) 8,950.3 8,876.1 + 0.8
Cargo load factor (%) 66.5 68.4 – 1.9 points
Load tonne-km (million) 12,734.6 12,985.3 – 1.9
Capacity tonne-km (million) 18,305.1 18,034.0 + 1.5
Overall load factor (%) 69.6 72.0 – 2.4 points
Employee Productivity – Company R2
Average number of employees 14,499 13,960 + 3.9
Seat capacity per employee (seat-km)R3 6,656,705 6,774,495 – 1.7
Passenger load carried per employee (tonne-km) R3 471,300 498,516 – 5.5
Revenue per employee ($) 535,554 592,077 – 9.5
Value added per employee ($) 185,958 277,407 – 33.0
Employee Productivity – Group
Average number of employees 29,316 28,336 + 3.5
Revenue per employee ($) 322,275 351,189 – 8.2
Value added per employee ($) 126,832 182,831 – 30.6
R1 Group here refers to the consolidated operating statistics of SIA Passenger Airline Company and Singapore Airlines Cargo.
R2 Data for 2000-01 are adjusted to allow meaningful comparisons because of Singapore Airlines Cargo’s corporatization on 1 July 2001.
R3 Based on average staff strength of passenger operations. Passenger load includes excess baggage carried.
GLOSSARY
Revenue passenger-km (pkm) = Number of passengers carried x distance flown (in km)
Available seat-km (ask) = Number of available seats x distance flown (in km)
Passenger load factor = Revenue passenger-km expressed as a percentage of available seat-km
Passenger yield = Operating passenger revenue from scheduled services divided by
passenger-km flown
Passenger unit cost = Operating passenger-related expenditure divided by available seat-km
Passenger breakeven load factor = Theoretical load factor at which operating passenger-related expenditure less
bellyhold revenue from Singapore Airlines Cargo equals operating passenger and
excess baggage revenue
Cargo load tonne-km = Cargo load carried (in tonnes) x distance flown (in km)
Cargo capacity tonne-km = Cargo capacity production (in tonnes) x distance flown (in km)
Cargo load factor = Cargo load tonne-km expressed as a percentage of cargo capacity tonne-km
Load tonne-km (ltk) = Load carried (in tonnes) x distance flown (in km)
Capacity tonne-km (ctk) = Capacity production (in tonnes) x distance flown (in km)
Overall load factor = Load tonne-km expressed as a percentage of capacity tonne-km