Singapore Airlines 2002 Annual Report Download - page 35
Download and view the complete annual report
Please find page 35 of the 2002 Singapore Airlines annual report below. You can navigate through the pages in the report by either clicking on the pages listed below, or by using the keyword search tool below to find specific information within the annual report.-
 1
1 -
2
-
3
-
4
-
5
-
6
-
7
-
8
-
9
-
10
-
11
-
12
-
13
-
14
-
15
-
16
-
17
-
18
-
19
-
20
-
21
-
22
-
23
-
24
-
 25
25 -
 26
26 -
 27
27 -
 28
28 -
 29
29 -
 30
30 -
 31
31 -
 32
32 -
 33
33 -
 34
34 -
 35
35 -
 36
36 -
 37
37 -
 38
38 -
 39
39 -
 40
40 -
 41
41 -
 42
42 -
 43
43 -
 44
44 -
 45
45 -
46
-
47
-
48
-
49
-
50
-
51
-
52
-
53
-
54
-
55
-
56
-
57
-
58
-
59
-
60
-
61
-
62
-
63
-
64
-
65
-
66
-
67
-
68
-
69
-
70
-
71
-
72
-
73
-
74
-
75
-
76
-
77
-
78
-
79
-
80
-
81
-
82
-
83
-
84
-
85
-
86
-
87
-
88
-
89
-
90
-
91
-
92
-
93
-
94
-
95
-
96
-
97
-
98
-
99
-
100
-
101
-
102
-
103
-
104
-
105
-
106
-
107
-
108
-
109
-
110
-
111
-
112
-
113
-
114
-
115
-
116
 |
 |
SIA Annual Report 01/02 35
Financial Review
80
60
40
20
0
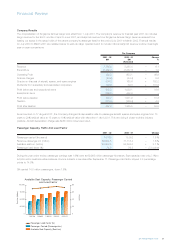
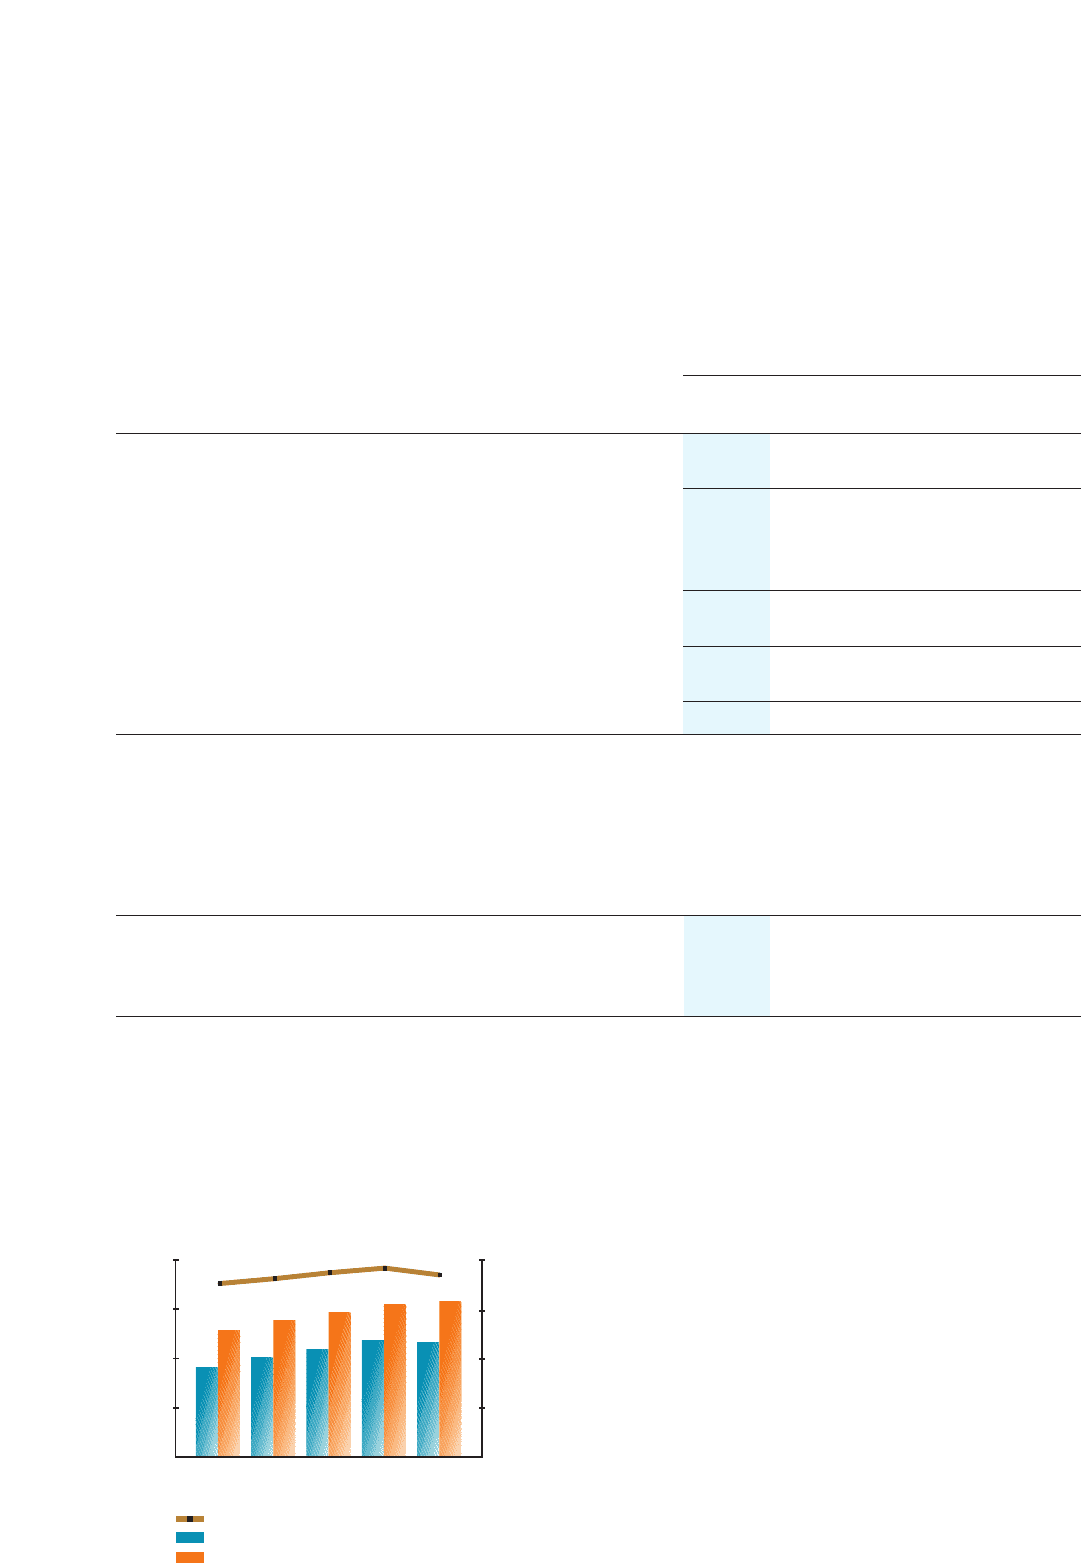
Available Seat Capacity, Passenger Carried
and Load Factor
Percent
Seat-km (Million)
1997/98 1998/99 1999/00 2000/01 2001/02
Passenger Load Factor (%)
Passenger Carried (Passenger-km)
Available Seat Capacity (Seat-km)
120,000
90,000
60,000
30,000
0
Company Results
The corporatization of Singapore Airlines Cargo took effect from 1 July 2001. The Company’s revenue for financial year 2001-02 includes
cargo revenue for the first 3 months of April to June 2001, and bellyhold revenue from Singapore Airlines Cargo (revenue received from
leasing out space in the cargo holds of the parent company’s passenger fleet) for the period July 2001 to March 2002. Financial results
for July 2000 to March 2001 are restated below to exclude cargo operations and to include notional bellyhold revenue to allow meaningful
year-on-year comparisons:
The Company
2001 - 02 2000 - 01 Change
$M $M %
(Restated)
Revenue 7,765.0 8,265.4 –6.1
Expenditure (7,282.7) (7,357.3) –1.0
Operating Profit 482.3 908.1 –46.9
Finance charges (46.9) (44.4) + 5.6
Surplus on disposal of aircraft, spares, and spare engines 334.8 165.6 + 102.2
Dividends from subsidiary and associated companies 138.6 59.8 + 131.8
Profit before tax and exceptional items 908.8 1,089.1 –16.6
Exceptional items (168.1) 442.8 –
Profit before taxation 740.7 1,531.9 –51.6
Taxation (173.5) (166.4) + 4.3
Profit after taxation 567.2 1,365.5 –58.5
As announced on 17 August 2001, the Company changed its depreciation rate for passenger aircraft, spares and spare engines from 10
years to 20% residual value to 15 years to 10% residual value with effect from 1 April 2001. This is to bring it closer to airline industry
practice. Aircraft depreciation charge was $265 million lower as a result.
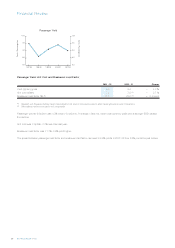
Passenger Capacity, Traffic And Load Factor
2001 - 02 2000 - 01 Change
Passenger carried (thousand) 14,765 15,002 –1.6 %
Revenue passenger-km (million) 69,994.5 71,118.4 –1.6 %
Available seat-km (million) 94,558.5 92,648.0 + 2.1 %
Passenger load factor (%) 74.0 76.8 –2.8 points
During the year under review, passenger carriage was 1.6% lower at 69,995 million passenger-kilometres. Seat capacity rose only 2.1% to
94,559 million seat-kilometres because of some cutback in services after September 11. Passenger load factor slipped 2.8 percentage
points to 74.0%.
SIA carried 14.8 million passengers, down 1.6%.