Singapore Airlines 2002 Annual Report Download - page 42
Download and view the complete annual report
Please find page 42 of the 2002 Singapore Airlines annual report below. You can navigate through the pages in the report by either clicking on the pages listed below, or by using the keyword search tool below to find specific information within the annual report.-
 1
1 -
2
-
3
-
4
-
5
-
6
-
7
-
8
-
9
-
10
-
11
-
12
-
13
-
14
-
15
-
16
-
17
-
18
-
19
-
20
-
21
-
22
-
23
-
24
-
25
-
26
-
27
-
28
-
29
-
30
-
31
-
 32
32 -
 33
33 -
 34
34 -
 35
35 -
 36
36 -
 37
37 -
 38
38 -
 39
39 -
 40
40 -
 41
41 -
 42
42 -
 43
43 -
 44
44 -
 45
45 -
 46
46 -
 47
47 -
 48
48 -
 49
49 -
 50
50 -
 51
51 -
 52
52 -
53
-
54
-
55
-
56
-
57
-
58
-
59
-
60
-
61
-
62
-
63
-
64
-
65
-
66
-
67
-
68
-
69
-
70
-
71
-
72
-
73
-
74
-
75
-
76
-
77
-
78
-
79
-
80
-
81
-
82
-
83
-
84
-
85
-
86
-
87
-
88
-
89
-
90
-
91
-
92
-
93
-
94
-
95
-
96
-
97
-
98
-
99
-
100
-
101
-
102
-
103
-
104
-
105
-
106
-
107
-
108
-
109
-
110
-
111
-
112
-
113
-
114
-
115
-
116
 |
 |
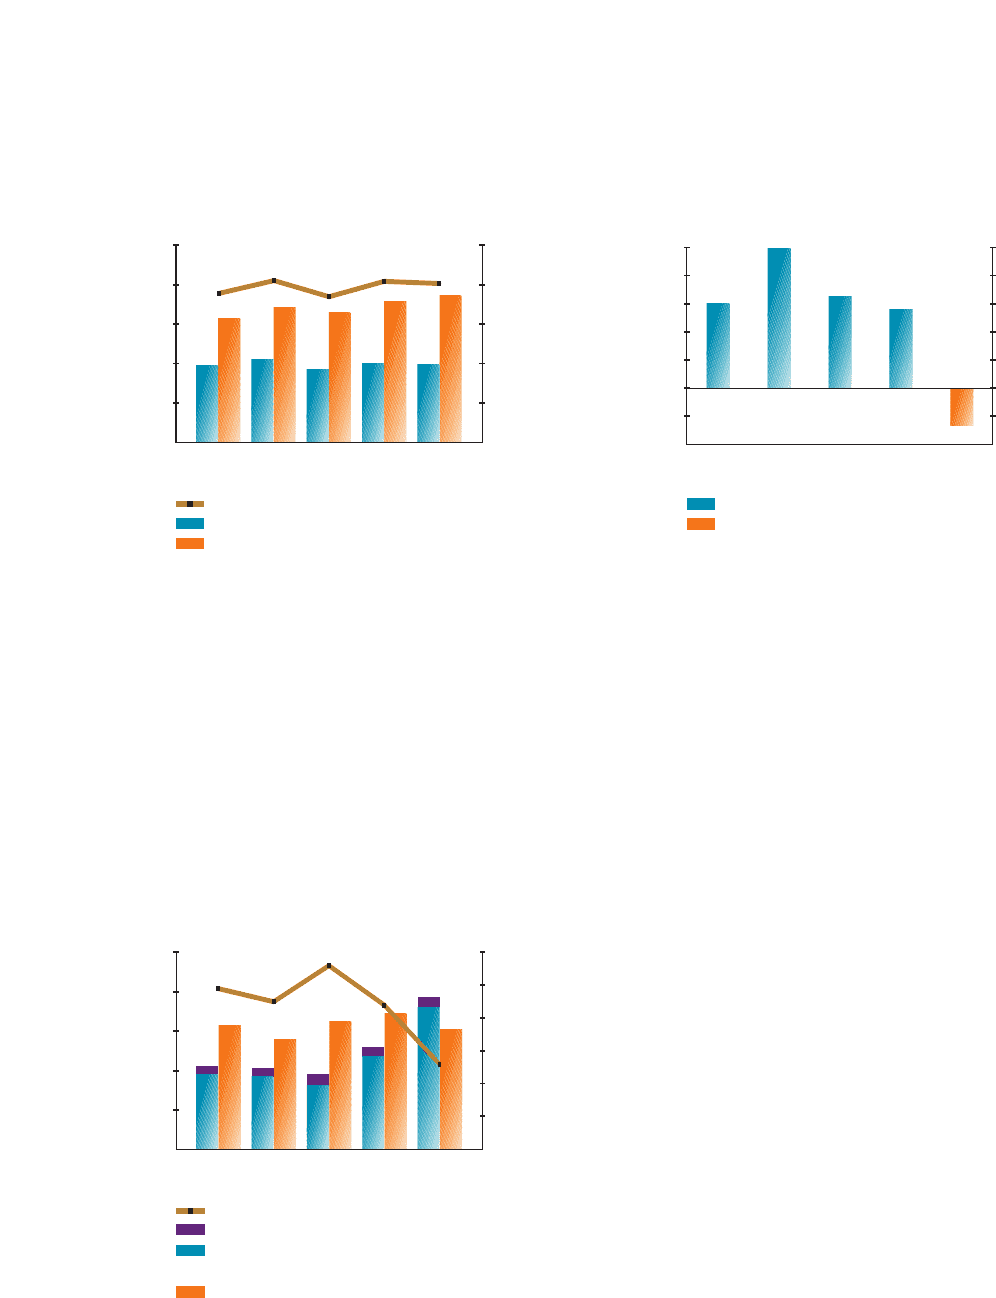
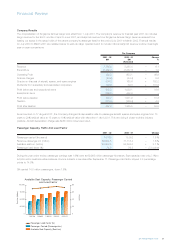
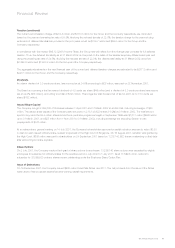
Financial Position
Shareholders’ funds of the Group stood at $9,847 million on 31 March 2002, down 1.5% (–$146 million) from a year ago after
accounting for share buyback costing $25 million and capital distribution of $609 million. Previous year’s shareholders’ funds at 31 March
2001 were restated to $9,993 million to comply with new and revised SAS.
The net tangible assets per share of the Group fell 1.3% (–$0.11) to $8.08 at 31 March 2002.
The Group’s total assets was $18,580 million as at 31 March 2002, 3.7% (+$669 million) higher from a year ago.
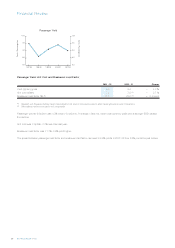
The liquidity position of the Group turned from net liquid assets of $1,418 million a year ago to a net debt of $656 million at 31 March
2002. This was largely the result of aircraft purchases, buyback of the Company’s shares and capital distribution to shareholders.
Proceeds from sales of aircraft and cash generated from operation cushioned the decline. The net debt equity ratio was 0.07 times.
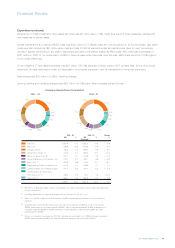
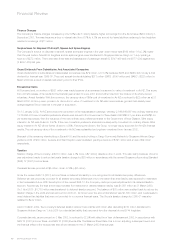
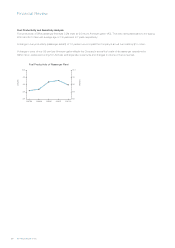
Capital Expenditure and Cash Flow
In 2001-02, capital expenditure by the Group was $3,863 million, 49.2% (+$1,274 million) more than the previous year. About 93% of
the capital spending were for two B747-400, five B777-200A, six B777-200ER, two B777-300 and one B777-200 passenger aircraft
delivered to SIA during the year, together with spare engines and spare parts. In addition, Singapore Airlines Cargo took delivery of two
B747-400 freighters, and one each of A319 and A320 passenger aircraft joined SilkAir’s fleet. Progress payments were also made for
additional aircraft scheduled for delivery between 2002 and 2009.
Internally generated cash flow declined 11.2% (–$385 million) to $3,054 million. Its contribution to financing of capital expenditure from
internal resources as measured by the ratio of cash flow to capital expenditure dropped to 0.79 times from 1.33 times last year.
Financial Review
SIA Annual Report 01/02
42
10
8
6
4
2
0
Group Shareholders’ Funds, Total Assets
and Net Tangible Assets Per Share
Dollars
$ Million
1998 1999 2000 2001 2002
31 March
NTA per share ($)
Shareholders’ Fund ($ Million)
Total Assets ($ Million)
25,000
20,000
15,000
10,000
5,000
0
2,500
2,000
1,500
1,000
500
0
-500
-1,000
Group Net Liquid Assets and Net Debt
$ Million
$ Million
1998 1999 2000 2001 2002
31 March
Net Liquid Assets
Net Debt
2,500
2,000
1,500
1,000
500
0
-500
-1,000
1.8
1.5
1.2
0.9
0.6
0.3
0
Group Capital Expenditure and
Internally Generated Cash Flow
Ratio
$ Million
1997/98 1998/99 1999/00 2000/01 2001/02
Cash Flow: Capital Expenditure Ratio
Other Capital Expenditure ($ million)
Capital Expenditure on Aircraft,
Engines and Spares ($ million)
Internally Generated Cash Flow ($ million)
5,000
4,000
3,000
2,000
1,000
0