Entergy 2004 Annual Report Download - page 88
Download and view the complete annual report
Please find page 88 of the 2004 Entergy annual report below. You can navigate through the pages in the report by either clicking on the pages listed below, or by using the keyword search tool below to find specific information within the annual report.-
 1
1 -
2
-
3
-
4
-
5
-
6
-
7
-
8
-
9
-
10
-
11
-
12
-
13
-
14
-
15
-
16
-
17
-
18
-
19
-
20
-
21
-
22
-
23
-
24
-
25
-
26
-
27
-
28
-
29
-
30
-
31
-
32
-
33
-
34
-
35
-
36
-
37
-
38
-
39
-
40
-
41
-
42
-
43
-
44
-
45
-
46
-
47
-
48
-
49
-
50
-
51
-
52
-
53
-
54
-
55
-
56
-
57
-
58
-
59
-
60
-
61
-
62
-
63
-
64
-
65
-
66
-
67
-
68
-
69
-
70
-
71
-
72
-
73
-
74
-
75
-
76
-
77
-
 78
78 -
 79
79 -
 80
80 -
 81
81 -
 82
82 -
 83
83 -
 84
84 -
 85
85 -
 86
86 -
 87
87 -
 88
88 -
 89
89 -
 90
90 -
 91
91 -
 92
92
 |
 |

-86 -
Entergy Corporation and Subsidiaries 2004
Entergy evaluates these unrealized gains and losses at the end of
each period to determine whether an other-than-temporary
impairment has occurred. This analysis considers the length of time
that a security has been in a loss position, the current performance
of that security, and whether decommissioning costs are recovered
in rates. Due to the regulatory treatment of decommissioning
collections and trust fund earnings, Entergy Arkansas, Entergy
Gulf States, Entergy Louisiana, and System Energy record
regulatory assets or liabilities for unrealized gains and losses on trust
investments. For the unregulated portion of River Bend, Entergy
Gulf States has recorded an offsetting amount of unrealized gains
or losses in other deferred credits. No significant impairments were
recorded in 2004 and 2003 as a result of these evaluations.
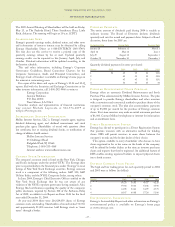
The fair value of debt securities, summarized by contractual
maturities, at December 31, 2004 is as follows (in millions):
Fair Value
Less than 1 year $ 134
1 year - 5 years 592
5 years - 10 years 425
10 years - 15 years 158
15 years - 20 years 60
20 years + 88
Total $1,457
During the year ended December 31, 2004, the proceeds from
the dispositions of securities amounted to $37 million with gross
gains of $0.7 million and gross losses of $0.7 million, which were
reclassified out of other comprehensiveincome into earnings during
the period.
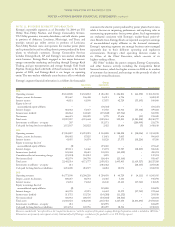
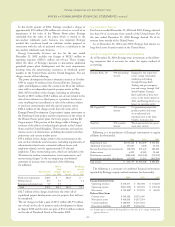
NOTE 16. QUARTERLY FINANCIAL DATA
(UNAUDITED)
Operating results for the four quarters of 2004 and 2003 were
(in thousands): Net
Operating Operating Income
Revenues Income (Loss)
2004
First Quarter $2,251,549 $378,834 $213,016
Second Quarter $2,485,097 $494,312 $271,011
Third Quarter $2,963,581 $571,472 $288,047
Fourth Quarter $2,423,497 $208,946 $160,975
2003
First Quarter $2,037,723 $363,403 $400,923(a)
Second Quarter $2,353,909 $461,576 $211,517
Third Quarter $2,700,125 $619,005 $371,650
Fourth Quarter $2,103,163 $ 40,571 $ (33,623)
(a) Net income before the cumulative effect of accounting changes for the first
quarter of 2003 was $258,001.
Earnings per Average CommonShare
2004 2003
Basic Diluted Basic Diluted
First Quarter $0.90 $0.88 $ 1.77(b) $ 1.73(b)
Second Quarter $1.16 $1.14 $ 0.91 $ 0.89
Third Quarter $1.24 $1.22 $ 1.60 $ 1.57
Fourth Quarter $0.71 $0.69 $(0.19) $(0.18)
(b) Basic and diluted earnings per average common share before the cumulative
effect of accounting changes for the first quarter of 2003 were $1.13 and
$1.10, respectively.
NOTES to CONSOLIDATED FINANCIAL STATEMENTS concluded