Entergy 2004 Annual Report Download - page 21
Download and view the complete annual report
Please find page 21 of the 2004 Entergy annual report below. You can navigate through the pages in the report by either clicking on the pages listed below, or by using the keyword search tool below to find specific information within the annual report.-
 1
1 -
2
-
3
-
4
-
5
-
6
-
7
-
8
-
9
-
10
-
 11
11 -
 12
12 -
 13
13 -
 14
14 -
 15
15 -
 16
16 -
 17
17 -
 18
18 -
 19
19 -
 20
20 -
 21
21 -
 22
22 -
 23
23 -
 24
24 -
 25
25 -
 26
26 -
 27
27 -
 28
28 -
 29
29 -
 30
30 -
 31
31 -
32
-
33
-
34
-
35
-
36
-
37
-
38
-
39
-
40
-
41
-
42
-
43
-
44
-
45
-
46
-
47
-
48
-
49
-
50
-
51
-
52
-
53
-
54
-
55
-
56
-
57
-
58
-
59
-
60
-
61
-
62
-
63
-
64
-
65
-
66
-
67
-
68
-
69
-
70
-
71
-
72
-
73
-
74
-
75
-
76
-
77
-
78
-
79
-
80
-
81
-
82
-
83
-
84
-
85
-
86
-
87
-
88
-
89
-
90
-
91
-
92
 |
 |
-19 -
Entergy Corporation and Subsidiaries 2004
internet-based work management
system that permits team members to
work on the same license renewal
project at the same time from multiple
locations. Entergy Nuclear, partnering
with Framatome, is the nation’s largest
contract provider of license renewal
services to the U.S. nuclear power
industry.
Intrinsic Growth
We pursue uprates when economically
attractive to increase the capacity and
output of our nuclear plants. As a
general rule of thumb, a 100 MW uprate
in our Nuclear Northeast fleet with an
$800 per KW capital investment and a
market price for power of $40 per MWh
yields approximately six cents in earnings
per share.
In 2004, we implemented plant
uprates at FitzPatrickand Indian
Point 2, bringing the total capacity of
our Northeast fleet to 4,058 MW. In
2005, we expect to complete uprates at
Waterford 3 and Indian Point 3, and we
willwork to resolve regulatory hurdles to
place in service the 50 MW uprate we
completed at Vermont Yankee in 2004.
We proactively engage in selling
power generated by the Northeast fleet
through forward contracts. At the end
of 2004, 95 percent of the planned
generation for 2005 was under contract,
89 percent for 2006, and 69 percent for
2007 at average prices per MWh of $39,
$40, and $42 respectively. That’s up
significantly from year-end 2003 when
average contract prices per MWh were
$37, $36, and $36 for 2005, 2006, and
2007 respectively. Going forward, we will
use insights from our ongoing relationship
with Merrill Lynch to keep our point of
view unbiased and current, enabling us
to determine the optimal portion of our
output to sell forward.
Opportunities Follow Capability
In 2003, we signed a first-of-its-kind
service contract with the Nebraska
Public Power District to operate its
Cooper Nuclear Station. Since then,
the NRChas noted improved
performance and recently closed
aCooper confirmatory action letter.
A$100 million capital improvement
program is onschedule. The NPPD
Board of Directors approved proceeding
with the NRC’s operating license
renewal process. And in 2004, Cooper
had its longest run in plant history.
Clearly, in one year Cooper has
undergone a remarkable turnaround. We
are proud of what we have been able to
accomplish and believe our capabilities
as a nuclear operator willprovide similar
opportunities in the very near future.
Allnuclear owners are facing
heightened regulatory scrutiny and we
believe that will motivate many small-
scale plant owners to exit the business.
Today, there are more than 30 small-
scale plants operating in the U.S. that
have either production costs greater
than $20 per MWh, low capacity
factors, event issues, low regulatory
scores, or all of the above. We believe
this segment of the market has good
potential for future plant sales or
management services contracts. In the
meantime, we will further develop the
already strong operational expertise that
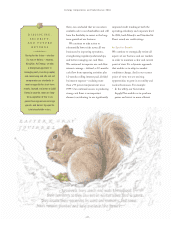
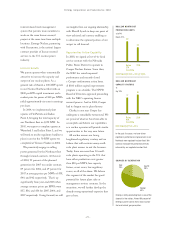
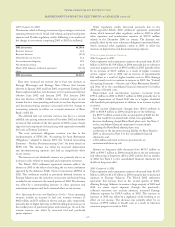
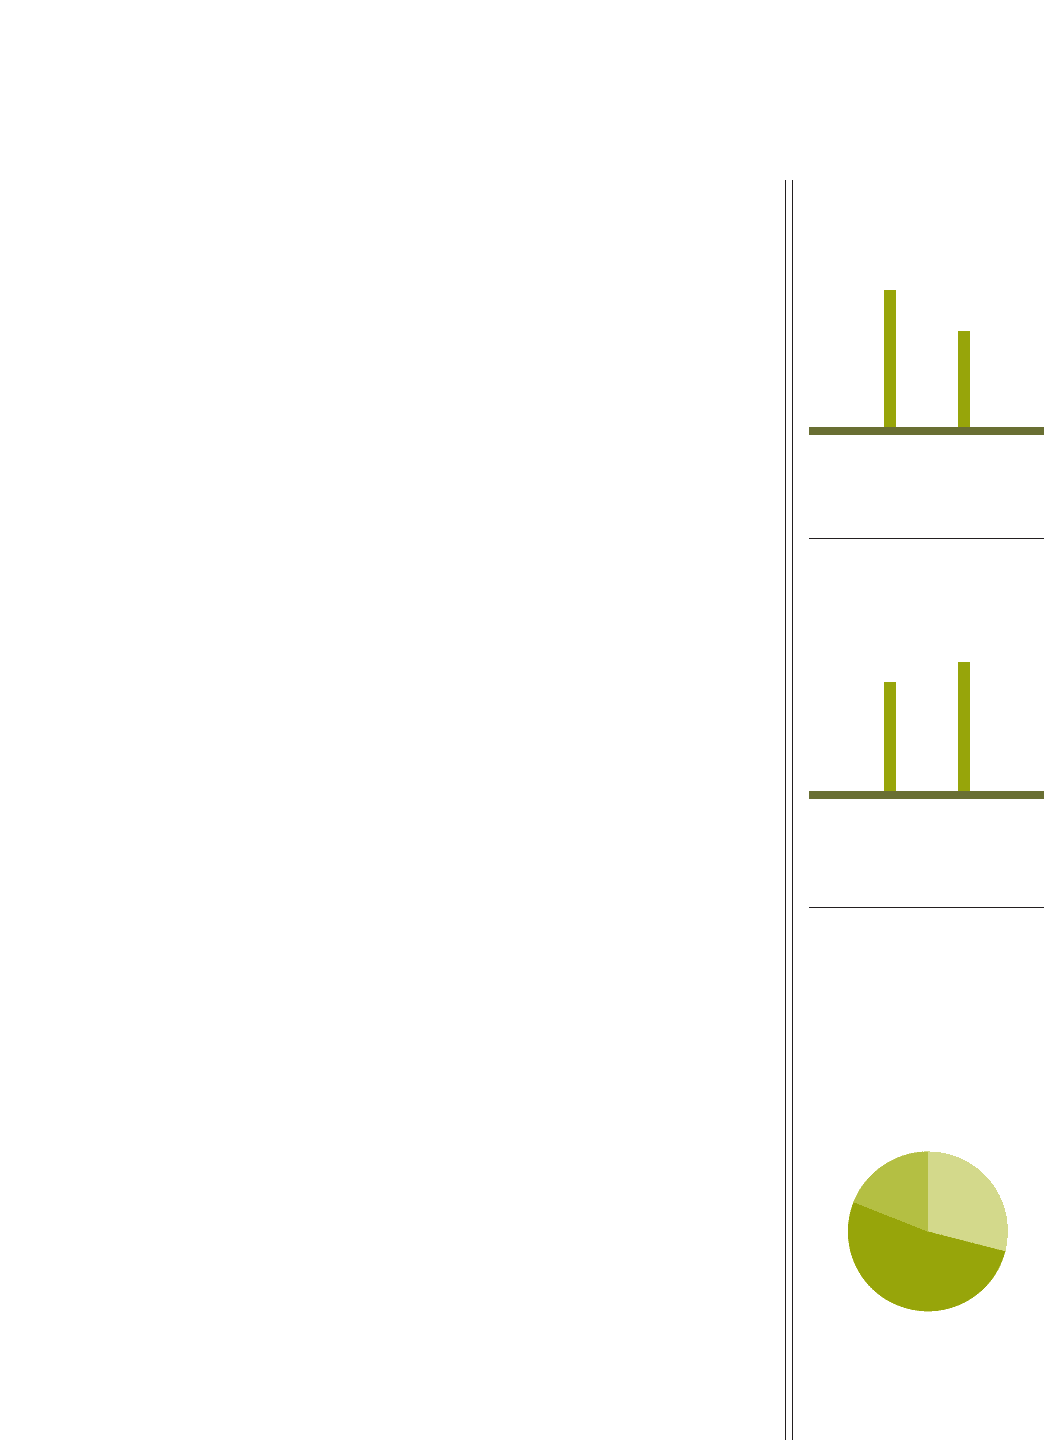
got us here. Entergy’s utility generating fleet is one of the
cleanest in the nation. Almost 80 percent of
Entergy’s power comes from clean nuclear
fuel and natural gas generation.
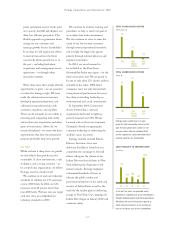
SOURCES OF GENERATION
Coal
19% Gas/Oil
29%
Nuclear
52%
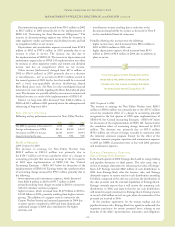
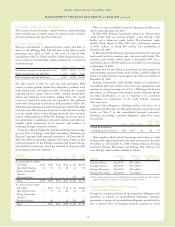
NUCLEAR NORTHEAST
PRODUCTION COSTS
$/MWh
Down 31%
Before
ETR
Ownership
2004
2004 Regulated Fleet = $15 per MWh
20
29
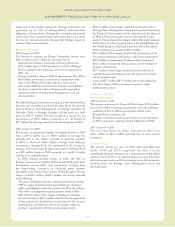
In the past five years, we have driven
significant performance improvement in our
Northeast non-regulated nuclear fleet. We
continue to target the performance levels
achieved by our regulated nuclear fleet.
NUCLEAR NORTHEAST
CAPACITY FACTORS
%
Up 19%
Before
ETR
Ownership
2004
92
77
2004 Regulated Fleet = 95%