Entergy 2004 Annual Report Download - page 74
Download and view the complete annual report
Please find page 74 of the 2004 Entergy annual report below. You can navigate through the pages in the report by either clicking on the pages listed below, or by using the keyword search tool below to find specific information within the annual report.-
 1
1 -
2
-
3
-
4
-
5
-
6
-
7
-
8
-
9
-
10
-
11
-
12
-
13
-
14
-
15
-
16
-
17
-
18
-
19
-
20
-
21
-
22
-
23
-
24
-
25
-
26
-
27
-
28
-
29
-
30
-
31
-
32
-
33
-
34
-
35
-
36
-
37
-
38
-
39
-
40
-
41
-
42
-
43
-
44
-
45
-
46
-
47
-
48
-
49
-
50
-
51
-
52
-
53
-
54
-
55
-
56
-
57
-
58
-
59
-
60
-
61
-
62
-
63
-
 64
64 -
 65
65 -
 66
66 -
 67
67 -
 68
68 -
 69
69 -
 70
70 -
 71
71 -
 72
72 -
 73
73 -
 74
74 -
 75
75 -
 76
76 -
 77
77 -
 78
78 -
 79
79 -
 80
80 -
 81
81 -
 82
82 -
 83
83 -
 84
84 -
85
-
86
-
87
-
88
-
89
-
90
-
91
-
92
 |
 |

-72 -
Entergy Corporation and Subsidiaries 2004
NOTES to CONSOLIDATED FINANCIAL STATEMENTS continued
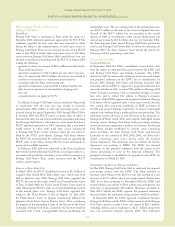
Equity Compensation Plan Information
Entergy grants stock options, equity awards, and incentive awards
to key employees of the Entergy subsidiaries under the Equity
Ownership Plan which is a shareholder-approved stock-based
compensation plan. Stock options are granted at exercise prices not
less than market value on the date of grant. The majority of options
granted in 2004, 2003, and 2002 will become exercisable in equal
amounts on each of the first three anniversaries of the date of grant.
Unless they are forfeited previously under the terms of the
grant, options expire ten years after the date of the grant if they
are not exercised.
Entergy grants most of the equity awards and incentive awards
earned under its stock benefit plans in the form of performance
units, which are equal to the cash value of shares of Entergy
Corporation common stock at the time of payment. In addition
to the potential for equivalent share appreciation or depreciation,
performance units will earn the cash equivalent of the dividends
paid during the performance period applicable to each plan. The
costs of equity and incentive awards, given either as company stock
or performance units, are charged to income over the period of the
grant or restricted period, as appropriate. In 2004, 2003, and 2002,
$47 million, $45 million, and $28 million, respectively, was charged
to compensation expense.
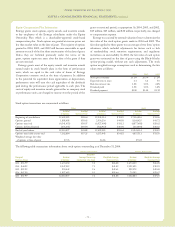
Entergy was assisted by external valuation firms to determine the
fair value of the stock option grants made in 2004 and 2003. The
fair value applied to these grants was an average of two firms’ option
valuations, which included adjustments for factors such as lack
of marketability, stock retention requirements, and regulatory
restrictions on exercisability. In 2002, the fair value of each option
grant was estimated on the date of grant using the Black-Scholes
option-pricing model, without any such adjustments. The stock
option weighted-average assumptions used in determining the fair
values were as follows:
2004 2003 2002
Stock price volatility 23.1% 26.3% 27.2%
Expected term in years 6.3 6.2 5.0
Risk-free interest rate 3.2% 3.3% 4.2%
Dividend yield 3.3% 3.3% 3.2%
Dividend payment $1.80 $1.40 $1.32
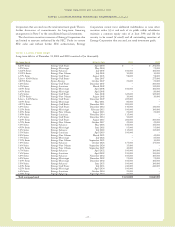
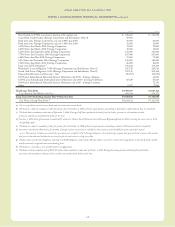
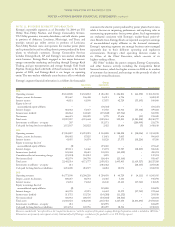
Stock option transactions are summarized as follows:
2004 2003 2002
Number Average Number Average Number Average
of Options Exercise Price of Options Exercise Price of Options Exercise Price
Beginning-of-year balance 15,429,383 $38.64 19,943,114 $35.85 17,316,816 $31.06
Options granted 1,898,098 $58.63 2,936,236 $44.98 8,168,025 $41.72
Options exercised (4,541,053) $38.07 (6,927,000) $33.12 (4,877,688) $28.62
Options forfeited/expired (476,351) $39.94 (522,967) $40.98 (664,039) $36.36
End-of-year balance 12,310,077 $41.88 15,429,383 $38.64 19,943,114 $35.85
Options exercisable at year-end 7,162,884 $37.25 6,153,043 $34.82 4,837,511 $31.39
Weighted-average fair value
of options at time of grant $7.76 $6.86 $9.22
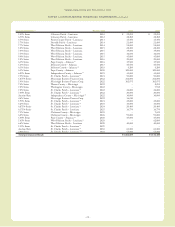
The following table summarizes information about stock options outstanding as of December 31, 2004:
Options Outstanding Options Exercisable
Weighted-
Range of Number Average Remaining Weighted-Average Number Weighted-Average
Exercise Prices of Options Contractual Life-Years Exercise Price of Options Exercise Price
$23 - $33.99 1,674,430 5.0 $26.28 1,674,430 $26.28
$34 - $44.99 8,547,519 7.1 $41.09 5,195,493 $39.95
$45 - $55.99 230,445 5.6 $49.61 222,378 $49.68
$56 - $67.99 1,857,683 9.1 $58.64 70,583 $59.67
$23 - $67.99 12,310,077 7.1 $41.88 7,162,884 $37.25