Entergy 2004 Annual Report Download - page 24
Download and view the complete annual report
Please find page 24 of the 2004 Entergy annual report below. You can navigate through the pages in the report by either clicking on the pages listed below, or by using the keyword search tool below to find specific information within the annual report.-
 1
1 -
2
-
3
-
4
-
5
-
6
-
7
-
8
-
9
-
10
-
11
-
12
-
13
-
 14
14 -
 15
15 -
 16
16 -
 17
17 -
 18
18 -
 19
19 -
 20
20 -
 21
21 -
 22
22 -
 23
23 -
 24
24 -
 25
25 -
 26
26 -
 27
27 -
 28
28 -
 29
29 -
 30
30 -
 31
31 -
 32
32 -
 33
33 -
 34
34 -
35
-
36
-
37
-
38
-
39
-
40
-
41
-
42
-
43
-
44
-
45
-
46
-
47
-
48
-
49
-
50
-
51
-
52
-
53
-
54
-
55
-
56
-
57
-
58
-
59
-
60
-
61
-
62
-
63
-
64
-
65
-
66
-
67
-
68
-
69
-
70
-
71
-
72
-
73
-
74
-
75
-
76
-
77
-
78
-
79
-
80
-
81
-
82
-
83
-
84
-
85
-
86
-
87
-
88
-
89
-
90
-
91
-
92
 |
 |

-22 -
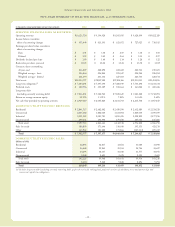
Entergy Corporation and Subsidiaries 2004
In thousands, except percentages and per share amounts 2004 2003 2002 2001 2000
SELECTED FINANCIAL DATA AS REPORTED:
Operating revenues $10,123,724 $ 9,194,920 $ 8,305,035 $ 9,620,899 $10,022,129
Income before cumulative
effect of accounting changes $ 933,049 $ 813,393 $ 623,072 $ 727,025 $ 710,915
Earnings per share before cumulative
effect of accounting changes
Basic $ 4.01 $ 3.48 $ 2.69 $ 3.18 $ 3.00
Diluted $ 3.93 $ 3.42 $ 2.64 $ 3.13 $ 2.97
Dividends declared per share $ 1.89 $ 1.60 $ 1.34 $ 1.28 $ 1.22
Book value per share, year-end $ 38.25 $ 38.02 $ 35.24 $ 33.78 $ 31.89
Common shares outstanding:
At year-end 216,829 228,898 222,422 220,733 219,605
Weighted average - basic 226,864 226,804 223,047 220,944 226,580
Weighted average - diluted 231,194 231,146 227,303 224,734 228,541
Total assets $28,310,777 $28,527,388 $27,504,366 $25,910,311 $25,451,896
Long-term obligations(a) $ 7,180,291 $ 7,497,690 $ 7,488,919 $ 7,743,298 $ 8,214,724
Preferred stock $ 382,756 $ 355,189 $ 358,664 $ 360,522 $ 400,446
Long-termdebt
(excluding currently maturing debt) $ 7,016,831 $ 7,322,940 $ 7,308,649 $ 7,321,028 $ 7,732,093
Return on average common equity 10.70% 11.21% 7.85% 10.04% 9.62%
Net cash flowprovided by operating activities $ 2,929,319 $ 2,005,820 $ 2,181,703 $ 2,215,548 $ 1,967,847
DOMESTIC UTILITY ELECTRIC REVENUES:
Residential $ 2,841,517 $ 2,682,802 $ 2,439,590 $ 2,612,889 $ 2,524,529
Commercial 2,045,382 1,882,060 1,672,964 1,860,040 1,699,699
Industrial 2,311,185 2,081,781 1,850,476 2,298,825 2,177,236
Governmental 199,631 194,998 179,508 205,054 185,286
Total retail 7,397,715 6,841,641 6,142,538 6,976,808 6,586,750
Sales for resale 388,899 371,646 330,010 395,353 423,519
Other 145,963 183,888 173,866 (127,334) 209,417
Total $ 7,932,577 $ 7,397,175 $ 6,646,414 $ 7,244,827 $ 7,219,686
DOMESTIC UTILITY ELECTRIC SALES:
(Millions of KWh)
Residential 32,896 32,817 32,581 31,080 31,998
Commercial 26,468 25,863 25,354 24,706 24,657
Industrial 40,293 38,637 41,018 41,577 43,956
Governmental 2,568 2,651 2,678 2,593 2,605
Total retail 102,225 99,968 101,631 99,956 103,216
Sales for resale 8,624 9,248 9,828 8,896 9,794
Total 110,849 109,216 111,459 108,852 113,010
(a) Includes long-term debt (excluding currently maturing debt), preferred stock with sinking fund, preferred securities of subsidiary trusts and partnership, and
noncurrent capital lease obligations.
FIVE-YEAR SUMMARY OF SELECTED FINANCIAL and OPERATING DATA