Entergy 2004 Annual Report Download - page 67
Download and view the complete annual report
Please find page 67 of the 2004 Entergy annual report below. You can navigate through the pages in the report by either clicking on the pages listed below, or by using the keyword search tool below to find specific information within the annual report.-
 1
1 -
2
-
3
-
4
-
5
-
6
-
7
-
8
-
9
-
10
-
11
-
12
-
13
-
14
-
15
-
16
-
17
-
18
-
19
-
20
-
21
-
22
-
23
-
24
-
25
-
26
-
27
-
28
-
29
-
30
-
31
-
32
-
33
-
34
-
35
-
36
-
37
-
38
-
39
-
40
-
41
-
42
-
43
-
44
-
45
-
46
-
47
-
48
-
49
-
50
-
51
-
52
-
53
-
54
-
55
-
56
-
 57
57 -
 58
58 -
 59
59 -
 60
60 -
 61
61 -
 62
62 -
 63
63 -
 64
64 -
 65
65 -
 66
66 -
 67
67 -
 68
68 -
 69
69 -
 70
70 -
 71
71 -
 72
72 -
 73
73 -
 74
74 -
 75
75 -
 76
76 -
 77
77 -
78
-
79
-
80
-
81
-
82
-
83
-
84
-
85
-
86
-
87
-
88
-
89
-
90
-
91
-
92
 |
 |

Entergy Corporation and Subsidiaries 2004
-65 -
improperly and imprudently included in the fuel adjustment filings.
Testimony was filed on behalf of the plaintiffs in this proceeding
asserting, among other things, that Entergy New Orleans and other
defendants have engaged in fuel procurement and power
purchasing practices and included costs in Entergy New Orleans’
fuel adjustment that could have resulted in New Orleans customers
being overcharged by more than $100 million over a period of years.
Hearings were held in February and March 2002. In February 2004,
the City Council approved a resolution that resulted in a refund to
customers of $11.3 million, including interest, during the
months of June through September 2004. The resolution
concludes, among other things, that the record does not support an
allegation that Entergy New Orleans’ actions or inactions, either
alone or in concert with Entergy or any of its affiliates, constituted
amisrepresentation or a suppression of the truth made in order to
obtain an unjust advantage of Entergy New Orleans, or to cause
loss, inconvenience, or harm to its ratepayers. Management believes
that it has adequately provided for the liability associated with this
proceeding. The plaintiffs have appealed the City Council
resolution to the state court in Orleans Parish. Oral argument on
the plaintiffs’ appeal was conducted in February 2005.
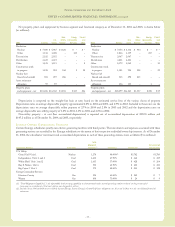
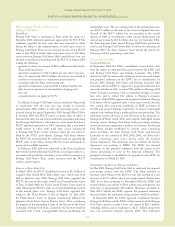
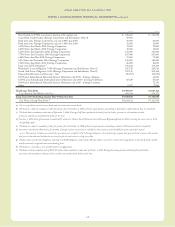
NOTE 3. INCOME TAXES
Income tax expenses for 2004, 2003, and 2002 consist of
the following (in thousands):
2004 2003 2002
Current:
Federal(a) (b) $ 54,380 $ (731,129) $ 510,109
Foreign (2,231) 8,284 (3,295)
State (a) (b) 38,301 23,396 43,788
Total(a) (b) 90,450 (699,449) 550,602
Deferred - net 296,445 1,307,092 (233,532)
Investment tax credit
adjustments - net (20,987) (27,644) (23,132)
Recorded income tax expense $ 365,908 $ 579,999 $ 293,938
(a) The actual cash taxes paid were $28,241 in 2004, $188,709 in 2003, and
$57,856 in 2002. Entergy Louisiana’smark-to-market tax accounting
election significantly reduced taxes paid in 2002. In 2001, Entergy
Louisiana changed its method of accounting for tax purposes related to its
wholesale electric power contracts. The most significant of these is the
contract to purchase power from the Vidalia project (the contract is discussed
in Note 8 to the consolidated financial statements). The new tax accounting
method has provided a cumulative cash flow benefit of approximately $790
million through 2004, which is expected to reverse in the years 2005 through
2031. The election did not reduce book income tax expense. The timing of the
reversal of this benefit depends on several variables, including the price of
power. Approximately half of the consolidated cash flow benefit of the
election occurred in 2001 and the remainder occurred in 2002.
(b) In 2003, the domestic utility companies and System Energy filed, with the IRS, a
change in tax accounting method notification for their respective calculations of
cost of goods sold. The adjustment implemented a simplified method of allocation
of overhead to the production of electricity, which is provided under the IRS
capitalization regulations. The cumulative adjustment placing these companies on
the new methodology resulted in a $2.95 billion deduction on Entergy’s 2003
income tax return. There was no cash benefit from the method change in 2003.
On a consolidated basis, a $74 million cash tax benefit was realized in 2004.
This tax accounting method change is an issue across the utility industry and will
likely be challenged by the IRS on audit.
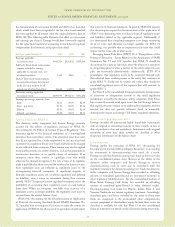
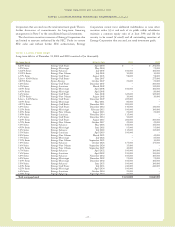
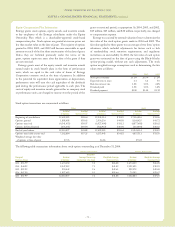
Total income taxes differ from the amounts computed by
applying the statutory income tax rate to income before taxes. The
reasons for the differences for the years 2004, 2003, and 2002 are:
(in thousands):
2004 2003 2002
Computed at statutory rate (35%) $454,635 $535,663 $320,954
Increases (reductions) in tax
resulting from:
State income taxes net of
federal income tax effect 36,185 54,024 44,835
Regulatory differences-
utility plant items 41,240 52,638 29,774
Amortization of investment
tax credits (20,596) (24,364) (22,294)
EAM Capital Loss (86,426) – –
Flow-through/permanent
differences (42,902) (30,221) (38,197)
U.S. tax on foreign income 2,014 7,888 (28,416)
Other – net (18,242) (15,629) (12,718)
Total income taxes $365,908 $579,999 $293,938
Effective income tax rate 28.2% 37.9% 32.1%
The EAM capital loss is a tax benefit resulting from the sale of
preferred stock and less than 1% of the common stock of Entergy
Asset Management, an Entergy subsidiary. In December 2004, an
Entergysubsidiarysold the stockto a thirdpartyfor $29.75 million.
The sale resulted in a capital loss for tax purposes
of $370 million, producing a federal and state net tax benefit of
$97 millionthat Entergyrecorded in the fourth quarter of 2004.
Entergyhas established a contingency provision in its financial
statements that management believes will sufficiently cover the risk
associated with this issue.
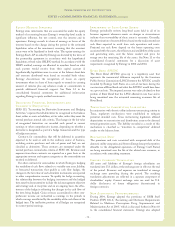
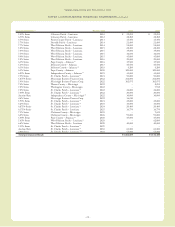
Significant components of net deferred and noncurrent accrued
tax liabilities as of December 31, 2004 and 2003 are as follows
(in thousands):
2004 2003
Deferred and Noncurrent
Accrued Tax Liabilities:
Net regulatoryliabilities $(978,815) $(1,072,898)
Plant-related basis differences (4,699,803) (3,574,593)
Power purchase agreements (972,348) (945,495)
Nuclear decommissioning (545,109) (519,028)
Other (346,993) (379,875)
Total (7,543,068) (6,491,889)
Deferred Tax Assets:
Accumulated deferred investment
tax credit 133,979 141,723
Capital losses 134,688 92,423
Net operating loss carryforwards 1,201,006 129,122
Sale and leaseback 227,155 223,134
Unbilled/deferred revenues 28,741 18,983
Pension-related items 247,662 204,083
Reserve for regulatory adjustments 131,112 138,933
Customer deposits 107,652 108,591
Nuclear decommissioning 158,796 272,551
Other 225,659 399,080
Valuation allowance (43,864) (39,210)
Total 2,552,586 1,689,413
Net deferred and noncurrent
accrued tax liability $(4,990,482) $(4,802,476)
NOTES to CONSOLIDATED FINANCIAL STATEMENTS continued