Entergy 2004 Annual Report Download - page 84
Download and view the complete annual report
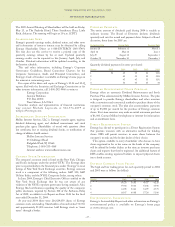
Please find page 84 of the 2004 Entergy annual report below. You can navigate through the pages in the report by either clicking on the pages listed below, or by using the keyword search tool below to find specific information within the annual report.-
 1
1 -
2
-
3
-
4
-
5
-
6
-
7
-
8
-
9
-
10
-
11
-
12
-
13
-
14
-
15
-
16
-
17
-
18
-
19
-
20
-
21
-
22
-
23
-
24
-
25
-
26
-
27
-
28
-
29
-
30
-
31
-
32
-
33
-
34
-
35
-
36
-
37
-
38
-
39
-
40
-
41
-
42
-
43
-
44
-
45
-
46
-
47
-
48
-
49
-
50
-
51
-
52
-
53
-
54
-
55
-
56
-
57
-
58
-
59
-
60
-
61
-
62
-
63
-
64
-
65
-
66
-
67
-
68
-
69
-
70
-
71
-
72
-
73
-
 74
74 -
 75
75 -
 76
76 -
 77
77 -
 78
78 -
 79
79 -
 80
80 -
 81
81 -
 82
82 -
 83
83 -
 84
84 -
 85
85 -
 86
86 -
 87
87 -
 88
88 -
 89
89 -
 90
90 -
 91
91 -
 92
92
 |
 |

-82 -
Entergy Corporation and Subsidiaries 2004
NOTES to CONSOLIDATED FINANCIAL STATEMENTS continued
NOTE 11. BUSINESS SEGMENT INFORMATION
Entergy’s reportable segments as of December 31, 2004 are U.S.
Utility, Non-Utility Nuclear, and Energy Commodity Services.
U.S. Utility generates, transmits, distributes, and sells electric power
in portions of Arkansas, Louisiana, Mississippi, and Texas, and
provides natural gas utility service in portions of Louisiana.
Non-Utility Nuclear owns and operates five nuclear power plants
and is primarily focused on selling electric power produced by those
plants to wholesale customers. Energy Commodity Services
includes Entergy-Koch, LP and Entergy’s non-nuclear wholesale
assets business. Entergy-Koch engaged in two major businesses:
energy commodity marketing and trading through Entergy-Koch
Trading, and gas transportation and storage through Gulf South
Pipeline. Entergy-Koch sold both of these businesses in the fourth
quarter of 2004, and Entergy-Koch is no longer an operating
entity. The non-nuclear wholesale assets business sells to wholesale
customers the electric power produced by power plants that it owns
while it focuses on improving performance and exploring sales or
restructuring opportunities for its power plants. Such opportunities
are evaluated consistent with Entergy’s market-based point-of-
view. Results from Entergy-Koch are reported as equity in earnings
of unconsolidated equity affiliates in the financial statements.
Entergy’s operating segments are strategic business units managed
separately due to their different operating and regulatory
environments. Entergy’s chief operating decision maker is
its Office of the Chief Executive, which consists of its
highest-ranking officers.
“All Other” includes the parent company, Entergy Corporation,
and other business activity, including the Competitive Retail
Services business, which has higher revenues in 2004 as its number
of customers has increased, and earnings on the proceeds of sales of
previously-owned businesses.
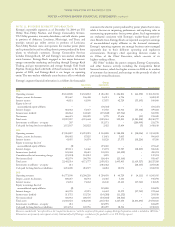
Energy
Non-Utility Commodity
U.S. Utility Nuclear* Services* All Other* Eliminations Consolidated
2004
Operating revenues $ 8,142,808 $1,341,852 $ 216,450 $ 486,804 $ (64,190) $ 10,123,724
Deprec., amort. & decomm. 915,667 106,408 16,311 6,736 – 1,045,122
Interest income 40,831 63,569 17,875 42,729 (55,195) 109,809
Equityin loss of
unconsolidated equityaffiliates – – (78,727) – – (78,727)
Interest charges 383,032 53,657 15,560 81,916 (55,142) 479,023
Income taxes (credits) 406,864 142,620 (155,840) (27,736) – 365,908
Net income 666,691 245,029 3,778 17,606 (55) 933,049
Total assets 22,937,237 4,531,604 2,223,961 199,233 (1,581,258) 28,310,777
Investments in affiliates - at equity 207 – 512,571 – (280,999) 231,779
Cash paid for long-lived asset additions 1,152,167 242,822 2,022 13,604 (5) 1,410,610
2003
Operating revenues $ 7,584,857 $1,274,983 $ 184,888 $ 188,228 $ (38,036) $ 9,194,920
Deprec., amort. & decomm. 890,092 87,825 13,681 5,005 – 996,603
Interest income 43,035 36,874 18,128 27,575 (38,226) 87,386
Equity in earnings (loss) of
unconsolidated equityaffiliates (3) – 271,650 – – 271,647
Interest charges 419,111 34,460 15,193 75,787 (38,225) 506,326
Income taxes (credits) 341,044 88,619 105,903 (45,492) – 490,074
Cumulative effect of accounting change (21,333) 154,512 3,895 – – 137,074
Net income (loss) 492,574 300,799 180,454 (23,360) – 950,467
Total assets 22,402,314 4,171,777 2,076,921 1,495,903 (1,619,527) 28,527,388
Investments in affiliates - at equity 211 – 1,081,462 – (28,345) 1,053,328
Cash paid for long-lived asset additions 1,233,208 281,377 44,284 10,074 – 1,568,943
2002
Operating revenues $ 6,773,509 $1,200,238 $ 294,670 $ 40,729 $ (4,111) $ 8,305,035
Deprec., amort. & decomm. 800,257 88,733 21,465 5,143 – 915,598
Interest income 23,231 71,262 26,140 35,433 (37,741) 118,325
Equity in earnings (loss) of
unconsolidated equity affiliates (2) – 183,880 – – 183,878
Interest charges 465,703 47,291 61,632 35,579 (37,741) 572,464
Income taxes (credits) 313,752 132,726 (141,288) (11,252) – 293,938
Net income (loss) 606,963 200,505 (145,830) (38,566) – 623,072
Total assets 21,630,523 4,482,308 2,167,472 1,327,354 (2,103,291) 27,504,366
Investments in affiliates - at equity 214 – 823,995 – – 824,209
Cash paid for long-lived asset additions 1,131,734 169,756 210,297 18,514 – 1,530,301
Businesses marked with * are referred to as the “competitive businesses,” with the exception of the parent company, Entergy Corporation, which is included in “All Other.”
Eliminations are primarily intersegment activity. Substantially all of Entergy’s recorded asset for goodwill is in its U.S. Utility segment.
Entergy’s segment financial information is as follows (in thousands):