Entergy 2004 Annual Report Download - page 82
Download and view the complete annual report
Please find page 82 of the 2004 Entergy annual report below. You can navigate through the pages in the report by either clicking on the pages listed below, or by using the keyword search tool below to find specific information within the annual report.-
 1
1 -
2
-
3
-
4
-
5
-
6
-
7
-
8
-
9
-
10
-
11
-
12
-
13
-
14
-
15
-
16
-
17
-
18
-
19
-
20
-
21
-
22
-
23
-
24
-
25
-
26
-
27
-
28
-
29
-
30
-
31
-
32
-
33
-
34
-
35
-
36
-
37
-
38
-
39
-
40
-
41
-
42
-
43
-
44
-
45
-
46
-
47
-
48
-
49
-
50
-
51
-
52
-
53
-
54
-
55
-
56
-
57
-
58
-
59
-
60
-
61
-
62
-
63
-
64
-
65
-
66
-
67
-
68
-
69
-
70
-
71
-
 72
72 -
 73
73 -
 74
74 -
 75
75 -
 76
76 -
 77
77 -
 78
78 -
 79
79 -
 80
80 -
 81
81 -
 82
82 -
 83
83 -
 84
84 -
 85
85 -
 86
86 -
 87
87 -
 88
88 -
 89
89 -
 90
90 -
 91
91 -
 92
92
 |
 |

-80 -
Entergy Corporation and Subsidiaries 2004
NOTES to CONSOLIDATED FINANCIAL STATEMENTS continued
Entergy’s trust asset investment strategy is to invest the assets in
amanner whereby long-term earnings on the assets (plus cash
contributions) provide adequate funding for retiree benefit
payments. The mix of assets is based on an optimization study that
identifies asset allocation targets in order to achieve the maximum
return for an acceptable level of risk, while minimizing the
expected contributions and pension and postretirement expense.
In the optimization study, Entergy formulates assumptions (or
hires a consultant to provide such analysis) about characteristics,
such as expected asset class investment returns, volatility (risk), and
correlation coefficients among the various asset classes. The future
market assumptions used in the optimization study are determined
by examining historical market characteristics of the various asset
classes, and making adjustments to reflect future conditions
expected to prevail over the study period.
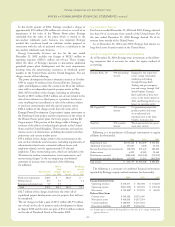
The optimization analysis utilized in Entergy’s latest study
produced the following approved asset class target allocations.
Pension Postretirement
Domestic EquitySecurities 45% 37%
International Equity Securities 20% 14%
Fixed–Income Securities 31% 49%
Other (Cash and GACs) 4% 0%
These allocation percentages combined with each asset class’
expected investment returnproduced an aggregate return
expectation for the five years following the study of 7.6% for
pension assets, 5.40% for taxable postretirement assets, and 7.2%
for non-taxable postretirement assets. These returns are not
inconsistent with Entergy’s disclosed expected pre-tax return on
assets of 8.50% over the life of the respective liabilities.
Since precise allocation targets are inefficient to manage security
investments, the following ranges were established to produce an
acceptable economically efficient plan to manage to targets:
Pension Postretirement
Domestic Equity Securities 45% to 55% 32% to 42%
International Equity Securities 15% to 25% 9% to 19%
Fixed–Income Securities 25% to 35% 44% to 54%
Other 0% to 10% 0% to 5%
Accumulated Pension Benefit Obligation
The accumulated benefit obligation for Entergy’s pension plans was
$2.3 billion and $2.1 billion at December 31, 2004 and 2003,
respectively.
Estimated Future Benefit Payments
Based upon the assumptions used to measure the company’s
pension and postretirement benefit obligation at December 31,
2004, and including pension and postretirement benefits
attributable to estimated future employee service, Entergy expects
that benefits to be paid over the next ten years will be as follows
(in thousands):
Estimated Future Benefits Payments
Years Pension Postretirement
2005 $115,203 $ 60,932
2006 $116,894 $ 59,761
2007 $119,092 $ 62,392
2008 $122,728 $ 64,381
2009 $127,877 $ 66,444
2010 – 2014 $780,295 $360,191
Contributions
Entergy expects to contribute $185.9 million (excluding about
$1.2 million in employee contributions) to its pension plans and
$63.3 million to other postretirement plans in 2005.
Additional Information
The change in the minimum pension liability included in other
comprehensive income and regulatory assets was as follows for 2004
and 2003 (in thousands):
2004 2003
Increase/(decrease) in the minimum
pension liability included in:
Other comprehensive income $(4,578) $ (1,639)
Regulatory assets $73,311 $(23,768)
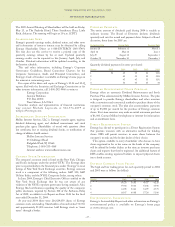
Actuarial Assumptions
The assumed health care cost trend rate used in measuring the
APBO of Entergywas 10% for 2005, gradually decreasing each
successive year until it reaches 4.5% in 2011 and beyond. The
assumed health care cost trend rate used in measuring the Net
Other Postretirement Benefit Cost of Entergy was 10% for 2004,
graduallydecreasing eachsuccessive year until it reaches 4.5% in
2010 and beyond. A one percentage point change in the assumed
health carecost trend rate for 2004 would havethe following effects
(in thousands):
1Percentage Point Increase 1 Percentage Point Decrease
Impact Impact
on the sum of on the sum of
Impact on service costs and Impact on service costs and
2004 the APBO interest cost the APBO interest cost
Entergy
Corporation $99,271 $11,587 $(89,801) $(10,061)
The significant actuarial assumptions used in determining the
pension PBO and the SFAS 106 APBO for 2004, 2003, and 2002
were as follows:
2004 2003 2002
Weighted-average discount rate:
Pension 6.00% 6.25% 6.75%
Other postretirement 6.00% 6.71% 6.75%
Weighted-average rate of increase
in future compensation levels 3.25% 3.25% 3.25%
Expected long-term rate of
return on plan assets:
Taxable assets 5.50% 5.50% 5.50%
Non-taxable assets 8.50% 8.75% 8.75%