Entergy 2004 Annual Report Download - page 50
Download and view the complete annual report
Please find page 50 of the 2004 Entergy annual report below. You can navigate through the pages in the report by either clicking on the pages listed below, or by using the keyword search tool below to find specific information within the annual report.-
 1
1 -
2
-
3
-
4
-
5
-
6
-
7
-
8
-
9
-
10
-
11
-
12
-
13
-
14
-
15
-
16
-
17
-
18
-
19
-
20
-
21
-
22
-
23
-
24
-
25
-
26
-
27
-
28
-
29
-
30
-
31
-
32
-
33
-
34
-
35
-
36
-
37
-
38
-
39
-
 40
40 -
 41
41 -
 42
42 -
 43
43 -
 44
44 -
 45
45 -
 46
46 -
 47
47 -
 48
48 -
 49
49 -
 50
50 -
 51
51 -
 52
52 -
 53
53 -
 54
54 -
 55
55 -
 56
56 -
 57
57 -
 58
58 -
 59
59 -
 60
60 -
61
-
62
-
63
-
64
-
65
-
66
-
67
-
68
-
69
-
70
-
71
-
72
-
73
-
74
-
75
-
76
-
77
-
78
-
79
-
80
-
81
-
82
-
83
-
84
-
85
-
86
-
87
-
88
-
89
-
90
-
91
-
92
 |
 |

-48 -
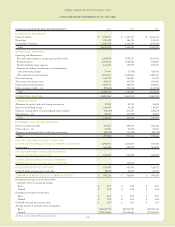
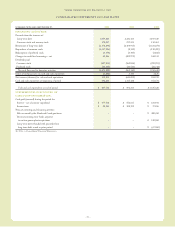
Entergy Corporation and Subsidiaries 2004
CONSOLIDATED STATEMENTS OF INCOME
In thousands, except share data, for the years ended December 31, 2004 2003 2002
OPERATING REVENUES:
Domestic electric $ 7,932,577 $ 7,397,175 $ 6,646,414
Natural gas 208,499 186,176 125,353
Competitive businesses 1,982,648 1,611,569 1,533,268
Total 10,123,724 9,194,920 8,305,035
OPERATING EXPENSES:
Operating and Maintenance:
Fuel, fuel-related expenses, and gas purchased for resale 2,488,208 1,987,217 2,154,596
Purchased power 2,092,922 1,728,526 833,829
Nuclear refueling outage expenses 166,072 159,995 105,592
Provision for turbine commitments, asset impairments,
and restructuring charges 55,000 (7,743) 428,456
Other operation and maintenance 2,303,561 2,453,869 2,486,617
Decommissioning 149,529 146,100 76,417
Taxes other than income taxes 409,886 405,659 380,462
Depreciation and amortization 895,593 850,503 839,181
Other regulatory credits – net (90,611) (13,761) (141,836)
Total 8,470,160 7,710,365 7,163,314
OPERATING INCOME 1,653,564 1,484,555 1,141,721
OTHER INCOME:
Allowance for equity funds used during construction 39,582 42,710 31,658
Interest and dividend income 109,809 87,386 118,325
Equity in earnings (loss) of unconsolidated equity affiliates (78,727) 271,647 183,878
Miscellaneous – net 53,752 (76,505) 13,892
Total 124,416 325,238 347,753
INTEREST AND OTHER CHARGES:
Interest onlong-termdebt 463,384 485,964 526,442
Other interest – net 41,380 53,553 70,560
Allowance for borrowed funds used during construction (25,741) (33,191) (24,538)
Total 479,023 506,326 572,464
INCOME BEFORE INCOME TAXES AND
CUMULATIVE EFFECT OF ACCOUNTING CHANGES 1,298,957 1,303,467 917,010
Income taxes 365,908 490,074 293,938
INCOME BEFORE CUMULATIVE EFFECT
OF ACCOUNTING CHANGES 933,049 813,393 623,072
CUMULATIVE EFFECT OF ACCOUNTING
CHANGES (NET OF INCOME TAXES OF $89,925) – 137,074 –
CONSOLIDATED NET INCOME 933,049 950,467 623,072
Preferred dividend requirements and other 23,525 23,524 23,712
EARNINGS APPLICABLE TO COMMON STOCK $909,524 $ 926,943 $ 599,360
Earnings per average common share before
cumulative effect of accounting changes:
Basic $ 4.01 $ 3.48 $ 2.69
Diluted $ 3.93 $ 3.42 $ 2.64
Earnings per average common share:
Basic $ 4.01 $ 4.09 $ 2.69
Diluted $ 3.93 $ 4.01 $ 2.64
Dividends declared per common share $ 1.89 $ 1.60 $ 1.34
Average number of commonshares outstanding:
Basic 226,863,758 226,804,370 223,047,431
Diluted 231,193,686 231,146,040 227,303,103
See Notes to Consolidated Financial Statements.