Entergy 2004 Annual Report Download - page 26
Download and view the complete annual report
Please find page 26 of the 2004 Entergy annual report below. You can navigate through the pages in the report by either clicking on the pages listed below, or by using the keyword search tool below to find specific information within the annual report.-
 1
1 -
2
-
3
-
4
-
5
-
6
-
7
-
8
-
9
-
10
-
11
-
12
-
13
-
14
-
15
-
 16
16 -
 17
17 -
 18
18 -
 19
19 -
 20
20 -
 21
21 -
 22
22 -
 23
23 -
 24
24 -
 25
25 -
 26
26 -
 27
27 -
 28
28 -
 29
29 -
 30
30 -
 31
31 -
 32
32 -
 33
33 -
 34
34 -
 35
35 -
 36
36 -
37
-
38
-
39
-
40
-
41
-
42
-
43
-
44
-
45
-
46
-
47
-
48
-
49
-
50
-
51
-
52
-
53
-
54
-
55
-
56
-
57
-
58
-
59
-
60
-
61
-
62
-
63
-
64
-
65
-
66
-
67
-
68
-
69
-
70
-
71
-
72
-
73
-
74
-
75
-
76
-
77
-
78
-
79
-
80
-
81
-
82
-
83
-
84
-
85
-
86
-
87
-
88
-
89
-
90
-
91
-
92
 |
 |

-24 -
Entergy Corporation and Subsidiaries 2004
U.S. Utility
The increase in earnings for the U.S. Utility for 2004 from
$469 million to $643 million was primarily due to the following:
•the $107.7 million ($65.6 million net-of-tax) accrual in 2003 of
the loss that would be associated with a final, non-appealable
decision disallowing abeyed River Bend plant costs. Refer to
Note 2 to the consolidated financial statements for more details
regarding the River Bend abeyed plant costs;
•lower other operation and maintenance expenses primarily due
to $99.8 million ($70.1 million net-of-tax) of charges recorded
in 2003 in connection with the voluntary severance program;
•the $21.3 million net-of-tax cumulative effect of a change in
accounting principle that reduced earnings at Entergy Gulf
States in the first quarter of 2003 upon implementation of
SFAS 143. See “Critical Accounting Estimates - SFAS 143”
below for discussion of the implementation of SFAS 143;
•miscellaneous other income of $27.7 million (pre-tax) in 2004
resulting from a revision of the decommissioning liability for
River Bend, as discussed in Note 8 to the consolidated
financial statements;
•higher net revenue; and
•lower interest charges.
The decrease in earnings for the U.S. Utility for 2003 from
$583 million to $469 million was primarily due to:
•the $107.7 million($65.6 million net-of-tax) accrual in 2003 of
the loss that would be associated with a final, non-appealable
decisiondisallowing abeyed River Bend plant costs;
•$99.8 million($70.1 million net-of-tax) of charges recorded in
2003 in connection with the voluntary severance program; and
•the $21.3 millionnet-of-tax cumulativeeffect of a change in
accounting principle that reduced earnings at Entergy Gulf
States in the first quarter of 2003 upon implementation of
SFAS 143. See “Critical Accounting Estimates - SFAS 143”
below for discussion of the implementation of SFAS 143.
Partially offsetting the decrease in earnings in 2003 were higher net
revenue and lower interest charges.
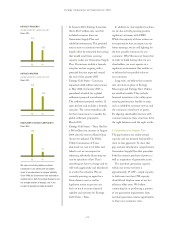
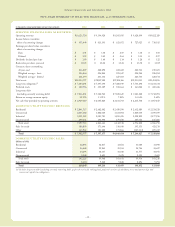
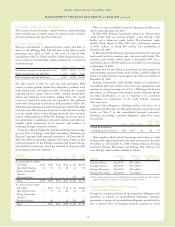
Net Revenue
2004 Compared to 2003
Net revenue, which is Entergy’s measure of gross margin, consists of
operating revenues net of: 1) fuel, fuel-related, and purchased power
expenses and 2) other regulatorycredits. Following is an analysis of
the change in net revenue comparing 2004 to 2003 (in millions):
2003 net revenue $4,214.5
Volume/weather 68.3
Summer capacity charges 17.4
Base rates 10.6
Deferred fuel cost revisions (46.3)
Price applied to unbilled sales (19.3)
Other (1.2)
2004 net revenue $4,244.0
The volume/weather variance resulted primarily from increased
usage, partially offset by the effect of milder weather on sales
during 2004 compared to 2003. Billed usage increased a total of
2,261 GWh in the industrial and commercial sectors.
The summer capacity charges variance was due to the
amortization in 2003 at Entergy Gulf States and Entergy Louisiana
of deferred capacity charges for the summer of 2001. Entergy Gulf
States’ amortization began in June 2002 and ended in May 2003.
Entergy Louisiana’s amortization began in August 2002 and ended
in July 2003.
Base rates increased net revenue due to a base rate increase at
Entergy New Orleans that became effective in June 2003.
The deferred fuel cost revisions variance resulted primarily from
arevision in 2003 to an unbilled sales pricing estimate to more
closely align the fuel component of that pricing with expected
recoverable fuel costs at Entergy Louisiana. Deferred fuel cost
revisions also decreased net revenue due to a revision in 2004 to the
estimate of fuel costs filed for recovery at Entergy Arkansas in the
March 2004 energy cost recovery rider.
The price applied to unbilled sales variance resulted from a
decrease in fuel price in 2004 caused primarily by the effect of
nuclear plant outages in 2003 on average fuel costs.
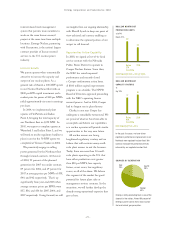
Gross Operating Revenues and Regulatory Credits – Gross operating
revenues include an increase in fuel cost recovery revenues of
$475 millionand $18 millionin electric and gas sales, respectively,
primarily due to higher fuel rates in 2004 resulting from increases in
the market prices of purchased power and natural gas. As such, this
revenue increase is offset by increased fuel and purchased
power expenses.
Other regulatorycredits increased primarily due to the following:
•cessationof the Grand Gulf Accelerated Recovery Tariff that
was suspended in July2003;
•the amortization in 2003 of deferred capacity charges for
summer 2001 power purchases at Entergy Gulf States and
Entergy Louisiana;
•the deferral in 2004 of $14.3 million of capacity charges related
to generation resource planning as allowed by the Louisiana
Public Service Commission (LPSC);
•the deferral in 2004 by Entergy Louisiana of $11.4 million
related to the voluntaryseverance program, in accordance with
aproposed stipulation entered into with the LPSC staff; and
•the deferral in August 2004 of $7.5 million of fossil plant
maintenance and voluntaryseverance program costs at Entergy
New Orleans as a result of a stipulation approved by the
Council of the Cityof New Orleans (City Council or Council).
MANAGEMENT’S FINANCIAL DISCUSSION and ANALYSIS continued