Entergy 2004 Annual Report Download - page 52
Download and view the complete annual report
Please find page 52 of the 2004 Entergy annual report below. You can navigate through the pages in the report by either clicking on the pages listed below, or by using the keyword search tool below to find specific information within the annual report.-
 1
1 -
2
-
3
-
4
-
5
-
6
-
7
-
8
-
9
-
10
-
11
-
12
-
13
-
14
-
15
-
16
-
17
-
18
-
19
-
20
-
21
-
22
-
23
-
24
-
25
-
26
-
27
-
28
-
29
-
30
-
31
-
32
-
33
-
34
-
35
-
36
-
37
-
38
-
39
-
40
-
41
-
 42
42 -
 43
43 -
 44
44 -
 45
45 -
 46
46 -
 47
47 -
 48
48 -
 49
49 -
 50
50 -
 51
51 -
 52
52 -
 53
53 -
 54
54 -
 55
55 -
 56
56 -
 57
57 -
 58
58 -
 59
59 -
 60
60 -
 61
61 -
 62
62 -
63
-
64
-
65
-
66
-
67
-
68
-
69
-
70
-
71
-
72
-
73
-
74
-
75
-
76
-
77
-
78
-
79
-
80
-
81
-
82
-
83
-
84
-
85
-
86
-
87
-
88
-
89
-
90
-
91
-
92
 |
 |

-50 -
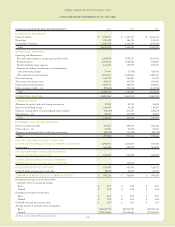
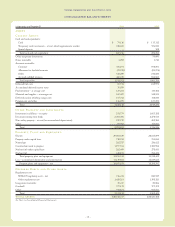
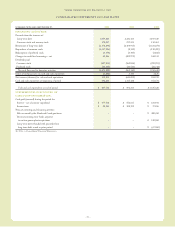
Entergy Corporation and Subsidiaries 2004
In thousands, as of December 31, 2004 2003
ASSETS
Current Assets:
Cash and cash equivalents:
Cash $ 79,136 $ 115,112
Temporary cash investments – at cost, which approximates market 728,600 576,813
Special deposits – 308
Total cash and cash equivalents 807,736 692,233
Other temporary investments – 50,000
Notes receivable 3,092 1,730
Accounts receivable:
Customer 435,191 398,091
Allowance for doubtful accounts (23,758) (25,976)
Other 342,289 246,824
Accrued unbilled revenues 460,039 384,860
Total receivables 1,213,761 1,003,799
Deferred fuel costs 85,911 245,973
Accumulated deferred income taxes 76,899 –
Fuel inventory – at average cost 127,251 110,482
Materials and supplies – at average cost 569,407 548,921
Deferred nuclear refueling outage costs 107,782 138,836
Prepayments and other 116,279 127,270
Total 3,108,118 2,919,244
Other Property and Investments:
Investment in affiliates – at equity 231,779 1,053,328
Decommissioning trust funds 2,453,406 2,278,533
Non-utility property – at cost (less accumulated depreciation) 219,717 262,384
Other 90,992 152,681
Total 2,995,894 3,746,926
Property, Plant and Equipment:
Electric 29,053,340 28,035,899
Property under capital lease 738,554 751,815
Natural gas 262,787 236,622
Constructionworkin progress 1,197,551 1,380,982
Nuclear fuel under capital lease 262,469 278,683
Nuclear fuel 320,813 234,421
Total property, plant and equipment 31,835,514 30,918,422
Less – accumulated depreciation and amortization 13,139,883 12,619,625
Property, plant and equipment – net 18,695,631 18,298,797
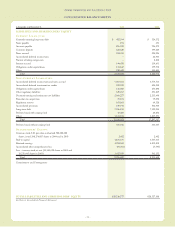
Deferred Debitsand Other Assets:
Regulatory assets:
SFAS 109 regulatory asset – net 746,413 830,539
Other regulatoryassets 1,429,261 1,398,323
Long-term receivables 39,417 20,886
Goodwill 377,172 377,172
Other 918,871 935,501
Total 3,511,134 3,562,421
TOTAL ASSETS $28,310,777 $28,527,388
See Notes to Consolidated Financial Statements.
CONSOLIDATED BALANCE SHEETS