Dollar General 2006 Annual Report Download - page 93
Download and view the complete annual report
Please find page 93 of the 2006 Dollar General annual report below. You can navigate through the pages in the report by either clicking on the pages listed below, or by using the keyword search tool below to find specific information within the annual report.-
 1
1 -
2
-
3
-
4
-
5
-
6
-
7
-
8
-
9
-
10
-
11
-
12
-
13
-
14
-
15
-
16
-
17
-
18
-
19
-
20
-
21
-
22
-
23
-
24
-
25
-
26
-
27
-
28
-
29
-
30
-
31
-
32
-
33
-
34
-
35
-
36
-
37
-
38
-
39
-
40
-
41
-
42
-
43
-
44
-
45
-
46
-
47
-
48
-
49
-
50
-
51
-
52
-
53
-
54
-
55
-
56
-
57
-
58
-
59
-
60
-
61
-
62
-
63
-
64
-
65
-
66
-
67
-
68
-
69
-
70
-
71
-
72
-
73
-
74
-
75
-
76
-
77
-
78
-
79
-
80
-
81
-
82
-
 83
83 -
 84
84 -
 85
85 -
 86
86 -
 87
87 -
 88
88 -
 89
89 -
 90
90 -
 91
91 -
 92
92 -
 93
93 -
 94
94 -
 95
95 -
 96
96 -
 97
97 -
 98
98 -
 99
99 -
 100
100 -
 101
101 -
 102
102 -
 103
103 -
104
-
105
-
106
-
107
-
108
-
109
-
110
-
111
-
112
-
113
-
114
-
115
-
116
-
117
-
118
-
119
-
120
-
121
-
122
-
123
-
124
-
125
-
126
-
127
-
128
-
129
-
130
-
131
-
132
-
133
-
134
-
135
-
136
-
137
-
138
-
139
-
140
-
141
-
142
-
143
-
144
-
145
-
146
-
147
-
148
-
149
-
150
-
151
-
152
-
153
-
154
-
155
-
156
-
157
-
158
-
159
-
160
-
161
-
162
-
163
-
164
-
165
 |
 |

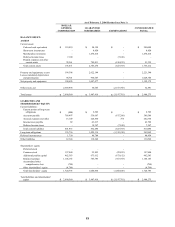
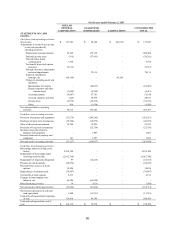
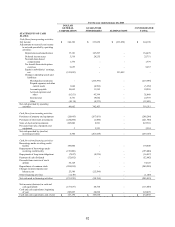
For the year ended February 3, 2006
DOLLAR
GENERAL
CORPORATION GUARANTOR
SUBSIDIARIES ELIMINATIONS CONSOLIDATED
TOTAL
STATEMENTS OF CASH
FLOWS:
Cash flows from operating activities:
Net income $350,155 $328,612 $(328,612) $ 350,155
Adjustments to reconcile net income
to net cash provided by
operating activities:
Depreciation and amortization 20,046 166,778 - 186,824
Deferred income taxes (750) 8,994 - 8,244
Noncash share-based
compensation 3,332 - - 3,332
Tax benefit from stock option
exercises 6,457 -- 6,457
Equity in subsidiaries’
earnings, net (328,612) -328,612 -
Change in operating assets and
liabilities:
Merchandise inventories - (97,877) - (97,877)
Prepaid expenses and
other current assets (4,546) (6,084) - (10,630)
Accounts payable (26,052) 113,282 - 87,230
Accrued expenses and
other (12,210) 52,586 - 40,376
Income taxes 13 (26,030) - (26,017)
Other 2,919 4,472 - 7,391
Net cash provided by operating
activities 10,752 544,733 - 555,485
Cash flows from investing activities:
Purchases of property and equipment (18,089) (266,023) - (284,112)
Purchases of short-term investments (123,925) (8,850) - (132,775)
Sales of short-term investments 166,350 500 - 166,850
Purchases of long-term investments - (16,995) - (16,995)
Insurance proceeds related to
property and equipment - 1,210 - 1,210
Proceeds from sale of property and
equipment 100 1,319 - 1,419
Net cash provided by (used in)
investing activities 24,436 (288,839) - (264,403)
Cash flows from financing activities:
Borrowings under revolving credit
facility 232,200 -- 232,200
Repayments of borrowings under
revolving credit facility (232,200) -- (232,200)
Issuance of long-term obligations - 14,495 - 14,495
Repayments of long-term obligations (4,969) (9,341) - (14,310)
Payment of cash dividends (56,183) -- (56,183)
Proceeds from exercise of stock
options 29,405 -- 29,405
Repurchases of common stock (297,602) -- (297,602)
Changes in intercompany note
balances, net 276,509 (276,509) - -
Other financing activities 892 -- 892
Net cash used in financing activities (51,948) (271,355) - (323,303)
Net decrease in cash and cash
equivalents (16,760) (15,461) - (32,221)
Cash and cash equivalents, beginning
of year 127,170 105,660 - 232,830
Cash and cash equivalents, end of
year $110,410 $90,199 $- $ 200,609
91