Dollar General 2006 Annual Report Download - page 51
Download and view the complete annual report
Please find page 51 of the 2006 Dollar General annual report below. You can navigate through the pages in the report by either clicking on the pages listed below, or by using the keyword search tool below to find specific information within the annual report.-
 1
1 -
2
-
3
-
4
-
5
-
6
-
7
-
8
-
9
-
10
-
11
-
12
-
13
-
14
-
15
-
16
-
17
-
18
-
19
-
20
-
21
-
22
-
23
-
24
-
25
-
26
-
27
-
28
-
29
-
30
-
31
-
32
-
33
-
34
-
35
-
36
-
37
-
38
-
39
-
40
-
 41
41 -
 42
42 -
 43
43 -
 44
44 -
 45
45 -
 46
46 -
 47
47 -
 48
48 -
 49
49 -
 50
50 -
 51
51 -
 52
52 -
 53
53 -
 54
54 -
 55
55 -
 56
56 -
 57
57 -
 58
58 -
 59
59 -
 60
60 -
 61
61 -
62
-
63
-
64
-
65
-
66
-
67
-
68
-
69
-
70
-
71
-
72
-
73
-
74
-
75
-
76
-
77
-
78
-
79
-
80
-
81
-
82
-
83
-
84
-
85
-
86
-
87
-
88
-
89
-
90
-
91
-
92
-
93
-
94
-
95
-
96
-
97
-
98
-
99
-
100
-
101
-
102
-
103
-
104
-
105
-
106
-
107
-
108
-
109
-
110
-
111
-
112
-
113
-
114
-
115
-
116
-
117
-
118
-
119
-
120
-
121
-
122
-
123
-
124
-
125
-
126
-
127
-
128
-
129
-
130
-
131
-
132
-
133
-
134
-
135
-
136
-
137
-
138
-
139
-
140
-
141
-
142
-
143
-
144
-
145
-
146
-
147
-
148
-
149
-
150
-
151
-
152
-
153
-
154
-
155
-
156
-
157
-
158
-
159
-
160
-
161
-
162
-
163
-
164
-
165
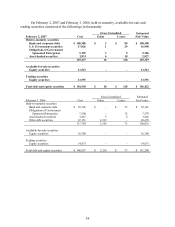
 |
 |

CONSOLIDATED STATEMENTS OF CASH FLOWS
(In thousands)
February 2,
2007
February 3,
2006
January 28,
2005
(52 weeks) (53 weeks) (52 weeks)
Cash flows from operating activities:
Net income $ 137,943
$ 350,155 $ 344,190
Adjustments to reconcile net income to net cash provided by
operating activities:
Depreciation and amortization 200,608 186,824 164,478
Deferred income taxes (38,218) 8,244 25,751
Noncash share-based compensation 7,578 3,332 1,779
Tax benefit from stock option exercises (2,513) 6,457 9,657
Noncash inventory adjustments and asset impairments 78,115 - -
Change in operating assets and liabilities:
Merchandise inventories (28,057) (97,877) (219,396)
Prepaid expenses and other current assets (5,411) (10,630) (3,352)
Accounts payable 53,544 87,230 22,258
Accrued expenses and other liabilities 38,353 40,376 35,048
Income taxes (35,165) (26,017) 23,793
Other (1,420) 7,391 (12,691)
Net cash provided by operating activities 405,357 555,485 391,515
Cash flows from investing activities:
Purchases of property and equipment (261,515) (284,112) (288,294)
Purchases of short-term investments (49,675) (132,775) (221,700)
Sales of short-term investments 51,525 166,850 247,501
Purchases of long-term investments (25,756) (16,995) -
Insurance proceeds related to property and equipment 1,807 1,210 -
Proceeds from sale of property and equipment 1,650 1,419 3,324
Net cash used in investing activities (281,964) (264,403) (259,169)
Cash flows from financing activities:
Borrowings under revolving credit facility 2,012,700 232,200 195,000
Repayments of borrowings under revolving credit facility (2,012,700) (232,200) (195,000)
Issuance of long-term obligations - 14,495 -
Repayments of long-term obligations (14,118) (14,310) (16,417)
Payment of cash dividends (62,472) (56,183) (52,682)
Proceeds from exercise of stock options 19,894 29,405 34,128
Repurchases of common stock (79,947) (297,602) (209,295)
Tax benefit of stock options 2,513 - -
Other financing activities (584) 892 (1,149)
Net cash used in financing activities (134,714) (323,303) (245,415)
Net decrease in cash and cash equivalents (11,321) (32,221) (113,069)
Cash and cash equivalents, beginning of year 200,609 232,830 345,899
Cash and cash equivalents, end of year $ 189,288 $ 200,609 $ 232,830
Supplemental cash flow information:
Cash paid during year for:
Interest $ 24,180
$ 25,747 $ 26,748
Income taxes $ 155,825
$ 205,802 $ 133,100
49