Dollar General 2006 Annual Report Download - page 31
Download and view the complete annual report
Please find page 31 of the 2006 Dollar General annual report below. You can navigate through the pages in the report by either clicking on the pages listed below, or by using the keyword search tool below to find specific information within the annual report.-
 1
1 -
2
-
3
-
4
-
5
-
6
-
7
-
8
-
9
-
10
-
11
-
12
-
13
-
14
-
15
-
16
-
17
-
18
-
19
-
20
-
 21
21 -
 22
22 -
 23
23 -
 24
24 -
 25
25 -
 26
26 -
 27
27 -
 28
28 -
 29
29 -
 30
30 -
 31
31 -
 32
32 -
 33
33 -
 34
34 -
 35
35 -
 36
36 -
 37
37 -
 38
38 -
 39
39 -
 40
40 -
 41
41 -
42
-
43
-
44
-
45
-
46
-
47
-
48
-
49
-
50
-
51
-
52
-
53
-
54
-
55
-
56
-
57
-
58
-
59
-
60
-
61
-
62
-
63
-
64
-
65
-
66
-
67
-
68
-
69
-
70
-
71
-
72
-
73
-
74
-
75
-
76
-
77
-
78
-
79
-
80
-
81
-
82
-
83
-
84
-
85
-
86
-
87
-
88
-
89
-
90
-
91
-
92
-
93
-
94
-
95
-
96
-
97
-
98
-
99
-
100
-
101
-
102
-
103
-
104
-
105
-
106
-
107
-
108
-
109
-
110
-
111
-
112
-
113
-
114
-
115
-
116
-
117
-
118
-
119
-
120
-
121
-
122
-
123
-
124
-
125
-
126
-
127
-
128
-
129
-
130
-
131
-
132
-
133
-
134
-
135
-
136
-
137
-
138
-
139
-
140
-
141
-
142
-
143
-
144
-
145
-
146
-
147
-
148
-
149
-
150
-
151
-
152
-
153
-
154
-
155
-
156
-
157
-
158
-
159
-
160
-
161
-
162
-
163
-
164
-
165
 |
 |
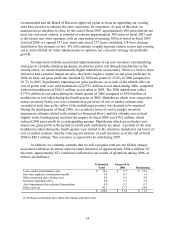
Net Sales. Increases in 2006 net sales resulted primarily from opening additional stores,
including 300 net new stores in 2006, and a same-store sales increase of 3.3% for 2006 compared
to 2005. Same-store sales increases are calculated based on the comparable calendar weeks in the
prior year. Accordingly, the same store sales percentages discussed herein exclude sales from
the 53rd week of 2005 as there was no comparable week in 2006 or 2004. The increase in same-
store sales accounted for $265.4 million of the increase in sales, while stores opened since the
beginning of 2006 were the primary contributors to the remaining $322.2 million sales increase
during 2006. The increase in same-store sales is primarily attributable to an increase in average
customer purchase. We also believe that the strategic merchandising and real estate initiatives
discussed above in the “Executive Overview” had a positive impact on net sales.
We monitor our sales internally by the following four major categories: highly
consumable, seasonal, home products and basic clothing. The highly consumable category has a
lower gross profit rate than the other three categories and has grown significantly over the past
several years. This shift is, in part, the result of our strategic efforts to broaden our consumable
product offerings and add more recognizable national brands in order to attract customers.
However, we believe the increase in consumables, as a percent of total sales, has also been
affected by changes in customers’ needs and by economic pressures, such as higher gasoline and
energy prices, which have resulted in reductions in the percentages of total sales of our home
products and basic clothing categories. As noted above in the “Executive Overview”, we expect
the move away from our packaway inventory strategy will have a positive impact on sales in our
non-consumable merchandise categories. Because of the impact of sales mix on gross profit, we
continually review our merchandise mix and strive to adjust it when appropriate. Maintaining an
appropriate sales mix among the four categories is an integral part of achieving our gross profit
and sales goals.
By merchandise category, our sales increase in 2006 compared to 2005 was primarily
attributable to the highly consumable category, which increased by $415.5 million, or 7.4%. An
increase in sales of seasonal merchandise of $161.2 million, or 12.0%, also contributed to overall
sales growth. We believe that our increased sales by merchandise category were supported by
recent additions to our product offerings and increased promotional activities, including the use
of advertising circulars and clearance activities.
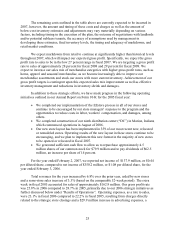
Increases in 2005 net sales resulted primarily from opening additional stores, including
609 net new stores in 2005, and a same-store sales increase of 2.0% for 2005 compared to 2004.
The increase in same-store sales accounted for $144.2 million of the increase in sales. Stores
opened since the beginning of 2004, as well as the $162.9 million impact of the 53rd week of
sales in fiscal year 2005 for all stores, were the primary contributors to the remaining $777.1
million sales increase during 2005. The increase in same-store sales is primarily attributable to
an increase in average customer purchase.
Same-store sales calculations for 2005 and prior include only those stores that were open
both at the end of that period and at the beginning of the preceding fiscal year. Beginning in
fiscal 2006, we revised and published our method for determining the stores that are included in
our publicly released same-store sales calculations. The revised same-store sales calculations
include those stores that have been open at least 13 full fiscal months and remain open at the end
29