Dollar General 2006 Annual Report Download - page 32
Download and view the complete annual report
Please find page 32 of the 2006 Dollar General annual report below. You can navigate through the pages in the report by either clicking on the pages listed below, or by using the keyword search tool below to find specific information within the annual report.-
 1
1 -
2
-
3
-
4
-
5
-
6
-
7
-
8
-
9
-
10
-
11
-
12
-
13
-
14
-
15
-
16
-
17
-
18
-
19
-
20
-
21
-
 22
22 -
 23
23 -
 24
24 -
 25
25 -
 26
26 -
 27
27 -
 28
28 -
 29
29 -
 30
30 -
 31
31 -
 32
32 -
 33
33 -
 34
34 -
 35
35 -
 36
36 -
 37
37 -
 38
38 -
 39
39 -
 40
40 -
 41
41 -
 42
42 -
43
-
44
-
45
-
46
-
47
-
48
-
49
-
50
-
51
-
52
-
53
-
54
-
55
-
56
-
57
-
58
-
59
-
60
-
61
-
62
-
63
-
64
-
65
-
66
-
67
-
68
-
69
-
70
-
71
-
72
-
73
-
74
-
75
-
76
-
77
-
78
-
79
-
80
-
81
-
82
-
83
-
84
-
85
-
86
-
87
-
88
-
89
-
90
-
91
-
92
-
93
-
94
-
95
-
96
-
97
-
98
-
99
-
100
-
101
-
102
-
103
-
104
-
105
-
106
-
107
-
108
-
109
-
110
-
111
-
112
-
113
-
114
-
115
-
116
-
117
-
118
-
119
-
120
-
121
-
122
-
123
-
124
-
125
-
126
-
127
-
128
-
129
-
130
-
131
-
132
-
133
-
134
-
135
-
136
-
137
-
138
-
139
-
140
-
141
-
142
-
143
-
144
-
145
-
146
-
147
-
148
-
149
-
150
-
151
-
152
-
153
-
154
-
155
-
156
-
157
-
158
-
159
-
160
-
161
-
162
-
163
-
164
-
165
 |
 |
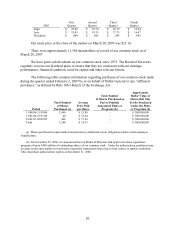
of the reporting period. Using the revised methodology, the same-store sales increase in 2005
was 2.2%.
Gross Profit. The gross profit rate decline in 2006 as compared with 2005 was due
primarily to a significant increase in markdown activity as a percentage of sales, including
below-cost markdowns, as a result of our inventory liquidation and store closing initiatives.
While we believe these initiatives had a positive impact on sales, they had a negative impact on
our gross profit rate in 2006. In total, our gross profit rate declined by 289 basis points to 25.8%
in 2006 compared to 28.7% in 2005. Significantly impacting our gross profit rate, as a result of
the related effect on cost of goods sold, were total markdowns of $279.1 million at cost taken
during 2006, compared with total markdowns of $106.5 million at cost taken in 2005. The 2006
markdowns reflect $179.9 million at cost taken during the fourth quarter of 2006 compared to
$39.0 million markdowns at cost taken during the fourth quarter of 2005. The fourth quarter
2006 change in merchandising strategy also resulted in our ending inventory being valued lower
than under our historical practices as ending inventory on-hand as of February 2, 2007 reflects
the immediate impact of the markdowns at the time such markdowns were taken rather than at
the time such inventory is sold. The impact of this reduction to inventory value approximated
$30.7 million in the fourth quarter of 2006. Markdowns which were expected to reduce inventory
below cost were considered in our lower of cost or market estimate and recorded at such time as
the utility of the underlying inventory was deemed to be impaired. During the third quarter of
fiscal 2006, we recorded a lower of cost or market inventory impairment estimate related to the
initiatives discussed above, and this estimate was revised slightly in the fourth quarter such that
the impact for fiscal 2006 was $70.2 million, which reduced 2006 gross profit by a
corresponding amount. Markdowns which are not below cost impact our gross profit in the
period in which such markdowns are taken. A portion of the total markdowns taken during the
fourth quarter were related to the inventory included in our lower of cost or market estimate,
thereby reducing our estimate of such inventory as of the end of fiscal 2006 to $49.2 million.
This inventory is expected to be sold during 2007. Other factors included, but were not limited
to: a decrease in the markups on purchases, primarily attributable to purchases of highly
consumable products (including nationally branded products, which generally have lower
average markups); and an increase in our shrink rate.
The gross profit rate declined by 82 basis points in 2005 as compared with 2004 due to a
number of factors, including but not limited to: lower sales (as a percentage of total sales) in our
seasonal, home products and basic clothing categories, which have higher than average markups;
an increase in markdowns as a percentage of sales primarily as a result of our initiative to reduce
per-store inventory; higher transportation expenses primarily attributable to increased fuel costs;
an increase in our shrink rate; and an estimated $5.2 million reduction resulting from the
expansion of the number of departments utilized for the gross profit calculation from 10 to 23, as
further described below under “Critical Accounting Policies and Estimates.” These factors were
partially offset by higher average mark-ups on our beginning inventory in 2005 as compared
with 2004.
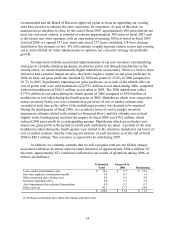
In 2006, 2005 and 2004, we experienced inventory shrinkage, stated as a percentage of
sales, of 3.40%, 3.22% and 3.05%, respectively.
30