Dollar General 2006 Annual Report Download - page 69
Download and view the complete annual report
Please find page 69 of the 2006 Dollar General annual report below. You can navigate through the pages in the report by either clicking on the pages listed below, or by using the keyword search tool below to find specific information within the annual report.-
 1
1 -
2
-
3
-
4
-
5
-
6
-
7
-
8
-
9
-
10
-
11
-
12
-
13
-
14
-
15
-
16
-
17
-
18
-
19
-
20
-
21
-
22
-
23
-
24
-
25
-
26
-
27
-
28
-
29
-
30
-
31
-
32
-
33
-
34
-
35
-
36
-
37
-
38
-
39
-
40
-
41
-
42
-
43
-
44
-
45
-
46
-
47
-
48
-
49
-
50
-
51
-
52
-
53
-
54
-
55
-
56
-
57
-
58
-
 59
59 -
 60
60 -
 61
61 -
 62
62 -
 63
63 -
 64
64 -
 65
65 -
 66
66 -
 67
67 -
 68
68 -
 69
69 -
 70
70 -
 71
71 -
 72
72 -
 73
73 -
 74
74 -
 75
75 -
 76
76 -
 77
77 -
 78
78 -
 79
79 -
80
-
81
-
82
-
83
-
84
-
85
-
86
-
87
-
88
-
89
-
90
-
91
-
92
-
93
-
94
-
95
-
96
-
97
-
98
-
99
-
100
-
101
-
102
-
103
-
104
-
105
-
106
-
107
-
108
-
109
-
110
-
111
-
112
-
113
-
114
-
115
-
116
-
117
-
118
-
119
-
120
-
121
-
122
-
123
-
124
-
125
-
126
-
127
-
128
-
129
-
130
-
131
-
132
-
133
-
134
-
135
-
136
-
137
-
138
-
139
-
140
-
141
-
142
-
143
-
144
-
145
-
146
-
147
-
148
-
149
-
150
-
151
-
152
-
153
-
154
-
155
-
156
-
157
-
158
-
159
-
160
-
161
-
162
-
163
-
164
-
165
 |
 |

While the 2005 and 2004 rates were similar overall, the rates contained offsetting
differences. Factors causing the 2005 tax rate to increase when compared to the 2004 tax rate
include a reduction in federal jobs credits of approximately $1.0 million, additional net foreign
income tax expense of approximately $0.8 million and a decrease in the contingent income tax
reserve due to resolution of contingent liabilities that was $3.6 million less than the decrease that
occurred in 2004. Factors causing the 2005 tax rate to decrease when compared to the 2004 tax
rate include the recognition of state tax credits of approximately $2.3 million related to the
Company’ s construction of a DC in Indiana and a benefit of approximately $2.6 million related
to an internal restructuring that was completed during 2005.
Deferred taxes reflect the effects of temporary differences between carrying amounts of
assets and liabilities for financial reporting purposes and the amounts used for income tax
purposes. Significant components of the Company’ s deferred tax assets and liabilities are as
follows:
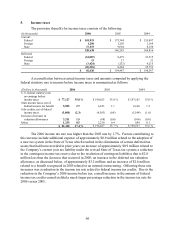
(In thousands) 2006 2005
Deferred tax assets:
Deferred compensation expense $ 10,090 $ 15,166
Accrued expenses and other 4,037 3,916
Accrued rent 10,487 7,137
Accrued insurance 9,899 9,240
Deferred gain on sale/leasebacks 2,312 2,465
Inventories 5,874 -
Other 4,609 3,712
State tax net operating loss carryforwards, net of federal tax 4,004 7,416
State tax credit carryforwards, net of federal tax 8,604 4,711
59,916 53,763
Less valuation allowances (5,249) (2,038)
Total deferred tax assets 54,667 51,725
Deferred tax liabilities:
Property and equipment (71,465) (74,609)
Inventories - (32,301)
Other (478) (536)
Total deferred tax liabilities (71,943) (107,446)
Net deferred tax liabilities $(17,276) $(55,721)
Net deferred tax liabilities are reflected separately on the consolidated balance sheets as
current and noncurrent deferred income taxes. The following table summarizes net deferred
income tax liabilities from the consolidated balance sheets:
(In thousands) 2006
2005
Restated
(see Note 1)
Current deferred income tax assets (liabilities), net $ 24,321 $ (7,267)
Noncurrent deferred income tax liabilities, net (41,597) (48,454)
Net deferred tax liabilities $(17,276) $(55,721)
State net operating loss carryforwards as of February 2, 2007, totaled approximately $94
million and will expire beginning in 2017 through 2027. The Company also has state tax credit
carryforwards of approximately $13.2 million that will expire beginning in 2007 through 2021.
67