Dollar General 2006 Annual Report Download - page 54
Download and view the complete annual report
Please find page 54 of the 2006 Dollar General annual report below. You can navigate through the pages in the report by either clicking on the pages listed below, or by using the keyword search tool below to find specific information within the annual report.-
 1
1 -
2
-
3
-
4
-
5
-
6
-
7
-
8
-
9
-
10
-
11
-
12
-
13
-
14
-
15
-
16
-
17
-
18
-
19
-
20
-
21
-
22
-
23
-
24
-
25
-
26
-
27
-
28
-
29
-
30
-
31
-
32
-
33
-
34
-
35
-
36
-
37
-
38
-
39
-
40
-
41
-
42
-
43
-
 44
44 -
 45
45 -
 46
46 -
 47
47 -
 48
48 -
 49
49 -
 50
50 -
 51
51 -
 52
52 -
 53
53 -
 54
54 -
 55
55 -
 56
56 -
 57
57 -
 58
58 -
 59
59 -
 60
60 -
 61
61 -
 62
62 -
 63
63 -
 64
64 -
65
-
66
-
67
-
68
-
69
-
70
-
71
-
72
-
73
-
74
-
75
-
76
-
77
-
78
-
79
-
80
-
81
-
82
-
83
-
84
-
85
-
86
-
87
-
88
-
89
-
90
-
91
-
92
-
93
-
94
-
95
-
96
-
97
-
98
-
99
-
100
-
101
-
102
-
103
-
104
-
105
-
106
-
107
-
108
-
109
-
110
-
111
-
112
-
113
-
114
-
115
-
116
-
117
-
118
-
119
-
120
-
121
-
122
-
123
-
124
-
125
-
126
-
127
-
128
-
129
-
130
-
131
-
132
-
133
-
134
-
135
-
136
-
137
-
138
-
139
-
140
-
141
-
142
-
143
-
144
-
145
-
146
-
147
-
148
-
149
-
150
-
151
-
152
-
153
-
154
-
155
-
156
-
157
-
158
-
159
-
160
-
161
-
162
-
163
-
164
-
165
 |
 |

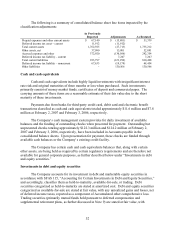
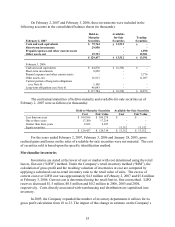
The following is a summary of consolidated balance sheet line items impacted by the
classification adjustments:
As Previously
Reported Adjustments As Restated
Prepaid expenses and other current assets $ 67,140 $ (15,801) $ 51,339
Deferred income tax asset – current 11,912 (11,912) -
Total current assets 1,762,925 (27,713) 1,735,212
Other assets, net 37,090 15,801 52,891
Accrued expenses and other 372,920 (130,566) 242,354
Deferred income tax liability – current - 7,267 7,267
Total current liabilities 933,797 (123,299) 810,498
Deferred income tax liability – noncurrent 67,633 (19,179) 48,454
Other liabilities - 130,566 130,566
Cash and cash equivalents
Cash and cash equivalents include highly liquid investments with insignificant interest
rate risk and original maturities of three months or less when purchased. Such investments
primarily consist of money market funds, certificates of deposit and commercial paper. The
carrying amounts of these items are a reasonable estimate of their fair value due to the short
maturity of these investments.
Payments due from banks for third-party credit card, debit card and electronic benefit
transactions classified as cash and cash equivalents totaled approximately $11.6 million and $7.8
million at February 2, 2007 and February 3, 2006, respectively.
The Company’ s cash management system provides for daily investment of available
balances and the funding of outstanding checks when presented for payment. Outstanding but
unpresented checks totaling approximately $122.3 million and $124.2 million at February 2,
2007 and February 3, 2006, respectively, have been included in Accounts payable in the
consolidated balance sheets. Upon presentation for payment, these checks are funded through
available cash balances or the Company’ s existing credit facility.
The Company has certain cash and cash equivalents balances that, along with certain
other assets, are being held as required by certain regulatory requirements and are therefore not
available for general corporate purposes, as further described below under “Investments in debt
and equity securities.”
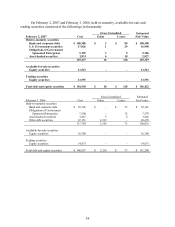
Investments in debt and equity securities
The Company accounts for its investment in debt and marketable equity securities in
accordance with SFAS 115, “Accounting for Certain Investments in Debt and Equity Securities,”
and accordingly, classifies them as held-to-maturity, available-for-sale, or trading. Debt
securities categorized as held-to-maturity are stated at amortized cost. Debt and equity securities
categorized as available-for-sale are stated at fair value, with any unrealized gains and losses, net
of deferred income taxes, reported as a component of Accumulated other comprehensive loss.
Trading securities (primarily mutual funds held pursuant to deferred compensation and
supplemental retirement plans, as further discussed in Note 9) are stated at fair value, with
52