Dollar General 2006 Annual Report Download - page 89
Download and view the complete annual report
Please find page 89 of the 2006 Dollar General annual report below. You can navigate through the pages in the report by either clicking on the pages listed below, or by using the keyword search tool below to find specific information within the annual report.-
 1
1 -
2
-
3
-
4
-
5
-
6
-
7
-
8
-
9
-
10
-
11
-
12
-
13
-
14
-
15
-
16
-
17
-
18
-
19
-
20
-
21
-
22
-
23
-
24
-
25
-
26
-
27
-
28
-
29
-
30
-
31
-
32
-
33
-
34
-
35
-
36
-
37
-
38
-
39
-
40
-
41
-
42
-
43
-
44
-
45
-
46
-
47
-
48
-
49
-
50
-
51
-
52
-
53
-
54
-
55
-
56
-
57
-
58
-
59
-
60
-
61
-
62
-
63
-
64
-
65
-
66
-
67
-
68
-
69
-
70
-
71
-
72
-
73
-
74
-
75
-
76
-
77
-
78
-
 79
79 -
 80
80 -
 81
81 -
 82
82 -
 83
83 -
 84
84 -
 85
85 -
 86
86 -
 87
87 -
 88
88 -
 89
89 -
 90
90 -
 91
91 -
 92
92 -
 93
93 -
 94
94 -
 95
95 -
 96
96 -
 97
97 -
 98
98 -
 99
99 -
100
-
101
-
102
-
103
-
104
-
105
-
106
-
107
-
108
-
109
-
110
-
111
-
112
-
113
-
114
-
115
-
116
-
117
-
118
-
119
-
120
-
121
-
122
-
123
-
124
-
125
-
126
-
127
-
128
-
129
-
130
-
131
-
132
-
133
-
134
-
135
-
136
-
137
-
138
-
139
-
140
-
141
-
142
-
143
-
144
-
145
-
146
-
147
-
148
-
149
-
150
-
151
-
152
-
153
-
154
-
155
-
156
-
157
-
158
-
159
-
160
-
161
-
162
-
163
-
164
-
165
 |
 |

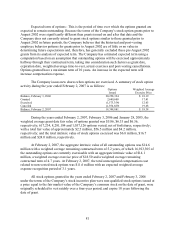
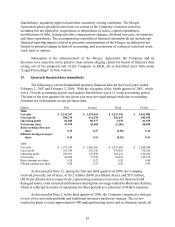
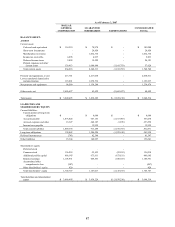
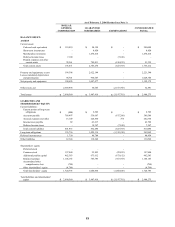
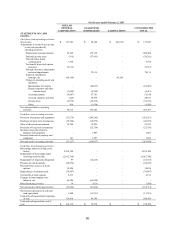
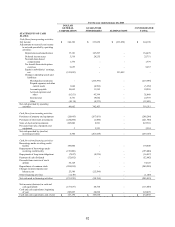
As of February 2, 2007
DOLLAR
GENERAL
CORPORATION GUARANTOR
SUBSIDIARIES ELIMINATIONS CONSOLIDATED
TOTAL
BALANCE SHEET:
ASSETS
Current assets:
Cash and cash equivalents $114,310 $74,978 $- $189,288
Short-term investments - 29,950 - 29,950
Merchandise inventories - 1,432,336 - 1,432,336
Income tax receivable 4,896 4,937 - 9,833
Deferred income taxes 5,099 19,222 - 24,321
Prepaid expenses and other
current assets 139,913 1,086,890 (1,169,783) 57,020
Total current assets 264,218 2,648,313 (1,169,783) 1,742,748
Property and equipment, at cost 213,781 2,217,030 - 2,430,811
Less accumulated depreciation
and amortization 115,201 1,078,736 - 1,193,937
Net property and equipment 98,580 1,138,294 - 1,236,874
Other assets, net 2,686,697 43,622 (2,669,427) 60,892
Total assets $3,049,495 $3,830,229 $(3,839,210) $3,040,514
LIABILITIES AND
SHAREHOLDERS’ EQUITY
Current liabilities:
Current portion of long-term
obligations $- $8,080 $- $8,080
Accounts payable 1,076,028 647,153 (1,167,907) 555,274
Accrued expenses and other 13,327 242,107 (1,876) 253,558
Income taxes payable - 15,959 - 15,959
Total current liabilities 1,089,355 913,299 (1,169,783) 832,871
Long-term obligations 199,842 1,584,526 (1,522,410) 261,958
Deferred income taxes (793) 42,390 - 41,597
Other liabilities 15,344 142,997 - 158,341
Shareholders’ equity:
Preferred stock - - - -
Common stock 156,218 23,853 (23,853) 156,218
Additional paid-in capital 486,145 673,611 (673,611) 486,145
Retained earnings 1,103,951 449,553 (449,553) 1,103,951
Accumulated other
comprehensive loss (987) - - (987)
Other shareholders’ equity 420 - - 420
Total shareholders’ equity 1,745,747 1,147,017 (1,147,017) 1,745,747
Total liabilities and shareholders’
equity $3,049,495 $3,830,229 $(3,839,210) $3,040,514
87