Dollar General 2006 Annual Report Download - page 56
Download and view the complete annual report
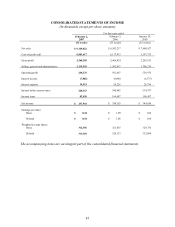
Please find page 56 of the 2006 Dollar General annual report below. You can navigate through the pages in the report by either clicking on the pages listed below, or by using the keyword search tool below to find specific information within the annual report.-
 1
1 -
2
-
3
-
4
-
5
-
6
-
7
-
8
-
9
-
10
-
11
-
12
-
13
-
14
-
15
-
16
-
17
-
18
-
19
-
20
-
21
-
22
-
23
-
24
-
25
-
26
-
27
-
28
-
29
-
30
-
31
-
32
-
33
-
34
-
35
-
36
-
37
-
38
-
39
-
40
-
41
-
42
-
43
-
44
-
45
-
 46
46 -
 47
47 -
 48
48 -
 49
49 -
 50
50 -
 51
51 -
 52
52 -
 53
53 -
 54
54 -
 55
55 -
 56
56 -
 57
57 -
 58
58 -
 59
59 -
 60
60 -
 61
61 -
 62
62 -
 63
63 -
 64
64 -
 65
65 -
 66
66 -
67
-
68
-
69
-
70
-
71
-
72
-
73
-
74
-
75
-
76
-
77
-
78
-
79
-
80
-
81
-
82
-
83
-
84
-
85
-
86
-
87
-
88
-
89
-
90
-
91
-
92
-
93
-
94
-
95
-
96
-
97
-
98
-
99
-
100
-
101
-
102
-
103
-
104
-
105
-
106
-
107
-
108
-
109
-
110
-
111
-
112
-
113
-
114
-
115
-
116
-
117
-
118
-
119
-
120
-
121
-
122
-
123
-
124
-
125
-
126
-
127
-
128
-
129
-
130
-
131
-
132
-
133
-
134
-
135
-
136
-
137
-
138
-
139
-
140
-
141
-
142
-
143
-
144
-
145
-
146
-
147
-
148
-
149
-
150
-
151
-
152
-
153
-
154
-
155
-
156
-
157
-
158
-
159
-
160
-
161
-
162
-
163
-
164
-
165
 |
 |

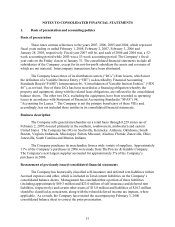
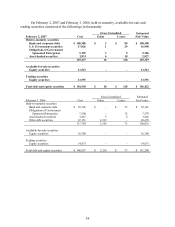
On February 2, 2007 and February 3, 2006, held-to-maturity, available-for-sale and
trading securities consisted of the following (in thousands):
Gross Unrealized
February 2, 2007 Cost
Gains Losses
Estimated
Fair Value
Held-to-maturity securities
Bank and corporate debt $ 100,386 $ 2 $ 80 $ 100,308
U.S. Government securities 17,026 1 29 16,998
Obligations of Government
Sponsored Enterprises 9,192 3 9 9,186
Asset-backed securities 2,833 4 10 2,827
129,437 10 128 129,319
Available-for-sale securities
Equity securities 13,512 - - 13,512
Trading securities
Equity securities 13,591 - - 13,591
Total debt and equity securities $ 156,540 $ 10 $ 128 $ 156,422
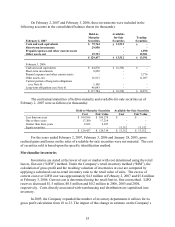
Gross Unrealized
February 3, 2006 Cost Gains Losses
Estimated
Fair Value
Held-to-maturity securities
Bank and corporate debt $ 59,196 $ - $ 55 $ 59,141
Obligations of Government
Sponsored Enterprises 7,590 - 12 7,578
Asset-backed securities 3,847 5 6 3,846
Other debt securities 47,151 2,319 - 49,470
117,784 2,324 73 120,035
Available-for-sale securities
Equity securities 16,300 - - 16,300
Trading securities
Equity securities 14,873 - - 14,873
Total debt and equity securities $ 148,957 $ 2,324 $ 73 $ 151,208
54