Dollar General 2006 Annual Report Download - page 23
Download and view the complete annual report
Please find page 23 of the 2006 Dollar General annual report below. You can navigate through the pages in the report by either clicking on the pages listed below, or by using the keyword search tool below to find specific information within the annual report.-
 1
1 -
2
-
3
-
4
-
5
-
6
-
7
-
8
-
9
-
10
-
11
-
12
-
 13
13 -
 14
14 -
 15
15 -
 16
16 -
 17
17 -
 18
18 -
 19
19 -
 20
20 -
 21
21 -
 22
22 -
 23
23 -
 24
24 -
 25
25 -
 26
26 -
 27
27 -
 28
28 -
 29
29 -
 30
30 -
 31
31 -
 32
32 -
 33
33 -
34
-
35
-
36
-
37
-
38
-
39
-
40
-
41
-
42
-
43
-
44
-
45
-
46
-
47
-
48
-
49
-
50
-
51
-
52
-
53
-
54
-
55
-
56
-
57
-
58
-
59
-
60
-
61
-
62
-
63
-
64
-
65
-
66
-
67
-
68
-
69
-
70
-
71
-
72
-
73
-
74
-
75
-
76
-
77
-
78
-
79
-
80
-
81
-
82
-
83
-
84
-
85
-
86
-
87
-
88
-
89
-
90
-
91
-
92
-
93
-
94
-
95
-
96
-
97
-
98
-
99
-
100
-
101
-
102
-
103
-
104
-
105
-
106
-
107
-
108
-
109
-
110
-
111
-
112
-
113
-
114
-
115
-
116
-
117
-
118
-
119
-
120
-
121
-
122
-
123
-
124
-
125
-
126
-
127
-
128
-
129
-
130
-
131
-
132
-
133
-
134
-
135
-
136
-
137
-
138
-
139
-
140
-
141
-
142
-
143
-
144
-
145
-
146
-
147
-
148
-
149
-
150
-
151
-
152
-
153
-
154
-
155
-
156
-
157
-
158
-
159
-
160
-
161
-
162
-
163
-
164
-
165
 |
 |

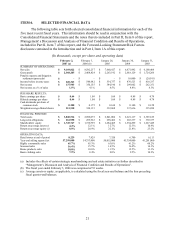
ITEM 6. SELECTED FINANCIAL DATA
The following table sets forth selected consolidated financial information for each of the
five most recent fiscal years. This information should be read in conjunction with the
Consolidated Financial Statements and the notes thereto included in Part II, Item 8 of this report,
Management’ s Discussion and Analysis of Financial Condition and Results of Operations,
included in Part II, Item 7 of this report, and the Forward-Looking Statement/Risk Factors
disclosure contained in the Introduction and in Part I, Item 1A of this report.
(In thousands, except per share and operating data)
February 2,
2007 (a)
February 3,
2006 (b)
January 28,
2005
January 30,
2004
January 31,
2003
SUMMARY OF OPERATIONS:
Net sales $ 9,169,822
$ 8,582,237 $ 7,660,927 $ 6,871,992 $ 6,100,404
Gross profit $ 2,368,205
$ 2,464,824 $ 2,263,192 $ 2,018,129 $ 1,724,266
Penalty expense and litigation
settlement (proceeds) $ – $ –
$ –
$ 10,000
$ (29,541)
Income before income taxes $ 220,363
$ 544,642
$ 534,757
$ 476,523
$ 410,337
Net income $ 137,943
$ 350,155 $ 344,190 $ 299,002 $ 262,351
Net income as a % of sales 1.5%
4.1% 4.5% 4.4% 4.3%
PER SHARE RESULTS:
Basic earnings per share $ 0.44
$ 1.09 $ 1.04 $ 0.89 $ 0.79
Diluted earnings per share $ 0.44
$ 1.08 $ 1.04 $ 0.89 $ 0.78
Cash dividends per share of
common stock $ 0.200
$ 0.175
$ 0.160
$ 0.140
$ 0.128
Weighted average diluted shares 313,510
324,133 332,068 337,636 335,050
FINANCIAL POSITION:
Total assets $ 3,040,514
$ 2,980,275 $ 2,841,004 $ 2,621,117 $ 2,303,619
Long-term obligations $ 261,958
$ 269,962 $ 258,462 $ 265,337 $ 330,337
Shareholders’ equity $ 1,745,747
$ 1,720,795 $ 1,684,465 $ 1,554,299 $ 1,267,445
Return on average assets (c) 4.4%
12.1% 12.7% 12.3% 10.9%
Return on average equity (c) 8.0%
20.9% 22.1% 21.4% 23.2%
OPERATING DATA:
Retail stores at end of period 8,229
7,929 7,320 6,700 6,113
Year-end selling square feet 57,299,000
54,753,000 50,015,000 45,354,000 41,201,000
Highly consumable sales 65.7%
65.3% 63.0% 61.2% 60.2%
Seasonal sales 16.4%
15.7% 16.5% 16.8% 16.3%
Home products sales 10.0%
10.6% 11.5% 12.5% 13.3%
Basic clothing sales 7.9%
8.4% 9.0% 9.5% 10.2%
(a) Includes the effects of certain strategic merchandising and real estate initiatives as further described in
“Management’ s Discussion and Analysis of Financial Condition and Results of Operations”.
(b) The fiscal year ended February 3, 2006 was comprised of 53 weeks.
(c) Average assets or equity, as applicable, is calculated using the fiscal year-end balance and the four preceding
fiscal quarter-end balances.
21