Dollar General 2006 Annual Report Download - page 90
Download and view the complete annual report
Please find page 90 of the 2006 Dollar General annual report below. You can navigate through the pages in the report by either clicking on the pages listed below, or by using the keyword search tool below to find specific information within the annual report.-
 1
1 -
2
-
3
-
4
-
5
-
6
-
7
-
8
-
9
-
10
-
11
-
12
-
13
-
14
-
15
-
16
-
17
-
18
-
19
-
20
-
21
-
22
-
23
-
24
-
25
-
26
-
27
-
28
-
29
-
30
-
31
-
32
-
33
-
34
-
35
-
36
-
37
-
38
-
39
-
40
-
41
-
42
-
43
-
44
-
45
-
46
-
47
-
48
-
49
-
50
-
51
-
52
-
53
-
54
-
55
-
56
-
57
-
58
-
59
-
60
-
61
-
62
-
63
-
64
-
65
-
66
-
67
-
68
-
69
-
70
-
71
-
72
-
73
-
74
-
75
-
76
-
77
-
78
-
79
-
 80
80 -
 81
81 -
 82
82 -
 83
83 -
 84
84 -
 85
85 -
 86
86 -
 87
87 -
 88
88 -
 89
89 -
 90
90 -
 91
91 -
 92
92 -
 93
93 -
 94
94 -
 95
95 -
 96
96 -
 97
97 -
 98
98 -
 99
99 -
 100
100 -
101
-
102
-
103
-
104
-
105
-
106
-
107
-
108
-
109
-
110
-
111
-
112
-
113
-
114
-
115
-
116
-
117
-
118
-
119
-
120
-
121
-
122
-
123
-
124
-
125
-
126
-
127
-
128
-
129
-
130
-
131
-
132
-
133
-
134
-
135
-
136
-
137
-
138
-
139
-
140
-
141
-
142
-
143
-
144
-
145
-
146
-
147
-
148
-
149
-
150
-
151
-
152
-
153
-
154
-
155
-
156
-
157
-
158
-
159
-
160
-
161
-
162
-
163
-
164
-
165
 |
 |

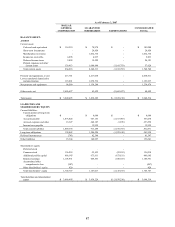
As of February 3, 2006 Restated (see Note 1)
DOLLAR
GENERAL
CORPORATION GUARANTOR
SUBSIDIARIES ELIMINATIONS CONSOLIDATED
TOTAL
BALANCE SHEET:
ASSETS
Current assets:
Cash and cash equivalents $110,410 $90,199 $- $200,609
Short-term investments - 8,850 - 8,850
Merchandise inventories - 1,474,414 - 1,474,414
Deferred income taxes 7,100 - (7,100) -
Prepaid expenses and other
current assets 78,361 789,811 (816,833) 51,339
Total current assets 195,871 2,363,274 (823,933) 1,735,212
Property and equipment, at cost 199,396 2,022,144 - 2,221,540
Less accumulated depreciation
and amortization 94,701 934,667 - 1,029,368
Net property and equipment 104,695 1,087,477 - 1,192,172
Other assets, net 2,389,994 36,665 (2,373,768) 52,891
Total assets $2,690,560 $3,487,416 $(3,197,701) $2,980,275
LIABILITIES AND
SHAREHOLDERS’ EQUITY
Current liabilities:
Current portion of long-term
obligations $(800) $9,585 $- $8,785
Accounts payable 789,497 536,097 (817,208) 508,386
Accrued expenses and other 13,149 228,830 375 242,354
Income taxes payable 89 43,617 - 43,706
Deferred income taxes - 14,367 (7,100) 7,267
Total current liabilities 801,935 832,496 (823,933) 810,498
Long-term obligations 153,756 1,429,116 (1,312,910) 269,962
Deferred income taxes 1,750 46,704 - 48,454
Other liabilities 12,324 118,242 - 130,566
Shareholders’ equity:
Preferred stock - - - -
Common stock 157,840 23,853 (23,853) 157,840
Additional paid-in capital 462,383 673,612 (673,612) 462,383
Retained earnings 1,106,165 363,393 (363,393) 1,106,165
Accumulated other
comprehensive loss (794) - - (794)
Other shareholders’ equity (4,799) - - (4,799)
Total shareholders’ equity 1,720,795 1,060,858 (1,060,858) 1,720,795
Total liabilities and shareholders’
equity $2,690,560 $3,487,416 $(3,197,701) $2,980,275
88