Dollar General 2006 Annual Report Download - page 72
Download and view the complete annual report
Please find page 72 of the 2006 Dollar General annual report below. You can navigate through the pages in the report by either clicking on the pages listed below, or by using the keyword search tool below to find specific information within the annual report.-
 1
1 -
2
-
3
-
4
-
5
-
6
-
7
-
8
-
9
-
10
-
11
-
12
-
13
-
14
-
15
-
16
-
17
-
18
-
19
-
20
-
21
-
22
-
23
-
24
-
25
-
26
-
27
-
28
-
29
-
30
-
31
-
32
-
33
-
34
-
35
-
36
-
37
-
38
-
39
-
40
-
41
-
42
-
43
-
44
-
45
-
46
-
47
-
48
-
49
-
50
-
51
-
52
-
53
-
54
-
55
-
56
-
57
-
58
-
59
-
60
-
61
-
 62
62 -
 63
63 -
 64
64 -
 65
65 -
 66
66 -
 67
67 -
 68
68 -
 69
69 -
 70
70 -
 71
71 -
 72
72 -
 73
73 -
 74
74 -
 75
75 -
 76
76 -
 77
77 -
 78
78 -
 79
79 -
 80
80 -
 81
81 -
 82
82 -
83
-
84
-
85
-
86
-
87
-
88
-
89
-
90
-
91
-
92
-
93
-
94
-
95
-
96
-
97
-
98
-
99
-
100
-
101
-
102
-
103
-
104
-
105
-
106
-
107
-
108
-
109
-
110
-
111
-
112
-
113
-
114
-
115
-
116
-
117
-
118
-
119
-
120
-
121
-
122
-
123
-
124
-
125
-
126
-
127
-
128
-
129
-
130
-
131
-
132
-
133
-
134
-
135
-
136
-
137
-
138
-
139
-
140
-
141
-
142
-
143
-
144
-
145
-
146
-
147
-
148
-
149
-
150
-
151
-
152
-
153
-
154
-
155
-
156
-
157
-
158
-
159
-
160
-
161
-
162
-
163
-
164
-
165
 |
 |

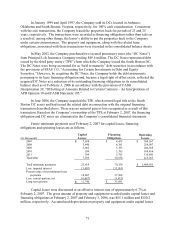
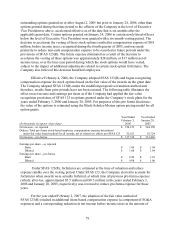
7. Earnings per share
The amounts reflected below are in thousands except per share data.
2006
Net
Income
Weighted Average
Shares
Per Share
Amount
Basic earnings per share $ 137,943 312,556 $ 0.44
Effect of dilutive stock options, restricted
stock and restricted stock units
954
Diluted earnings per share $ 137,943 313,510 $ 0.44
2005
Net
Income
Weighted Average
Shares
Per Share
Amount
Basic earnings per share $ 350,155 321,835 $ 1.09
Effect of dilutive stock options, restricted stock
and restricted stock units
2,298
Diluted earnings per share $ 350,155 324,133 $ 1.08
2004
Net
Income
Weighted Average
Shares
Per Share
Amount
Basic earnings per share $ 344,190 329,376 $ 1.04
Effect of dilutive stock options, restricted stock
and restricted stock units
2,692
Diluted earnings per share $ 344,190 332,068 $ 1.04
Basic earnings per share was computed by dividing net income by the weighted average
number of shares of common stock outstanding during the year. Diluted earnings per share was
determined based on the dilutive effect of stock options using the treasury stock method.
Options to purchase shares of common stock that were outstanding at the end of the
respective fiscal year, but were not included in the computation of diluted earnings per share
because the options’ exercise prices were greater than the average market price of the common
shares, were 15.0 million, 7.9 million and 7.3 million in 2006, 2005 and 2004, respectively.
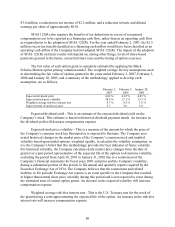
8. Commitments and contingencies
As of February 2, 2007, the Company was committed under capital and operating lease
agreements and financing obligations for most of its retail stores, three of its DCs, and certain of
its furniture, fixtures and equipment. The majority of the Company’ s stores are subject to short-
term leases (usually with initial or primary terms of three to five years) with multiple renewal
options when available. The Company also has stores subject to build-to-suit arrangements with
landlords, which typically carry a primary lease term of between 7 and 10 years with multiple
renewal options. Approximately half of the stores have provisions for contingent rentals based
upon a percentage of defined sales volume. Certain leases contain restrictive covenants. As of
February 2, 2007, the Company is not aware of any material violations of such covenants.
70