Dollar General 2006 Annual Report Download - page 67
Download and view the complete annual report
Please find page 67 of the 2006 Dollar General annual report below. You can navigate through the pages in the report by either clicking on the pages listed below, or by using the keyword search tool below to find specific information within the annual report.-
 1
1 -
2
-
3
-
4
-
5
-
6
-
7
-
8
-
9
-
10
-
11
-
12
-
13
-
14
-
15
-
16
-
17
-
18
-
19
-
20
-
21
-
22
-
23
-
24
-
25
-
26
-
27
-
28
-
29
-
30
-
31
-
32
-
33
-
34
-
35
-
36
-
37
-
38
-
39
-
40
-
41
-
42
-
43
-
44
-
45
-
46
-
47
-
48
-
49
-
50
-
51
-
52
-
53
-
54
-
55
-
56
-
 57
57 -
 58
58 -
 59
59 -
 60
60 -
 61
61 -
 62
62 -
 63
63 -
 64
64 -
 65
65 -
 66
66 -
 67
67 -
 68
68 -
 69
69 -
 70
70 -
 71
71 -
 72
72 -
 73
73 -
 74
74 -
 75
75 -
 76
76 -
 77
77 -
78
-
79
-
80
-
81
-
82
-
83
-
84
-
85
-
86
-
87
-
88
-
89
-
90
-
91
-
92
-
93
-
94
-
95
-
96
-
97
-
98
-
99
-
100
-
101
-
102
-
103
-
104
-
105
-
106
-
107
-
108
-
109
-
110
-
111
-
112
-
113
-
114
-
115
-
116
-
117
-
118
-
119
-
120
-
121
-
122
-
123
-
124
-
125
-
126
-
127
-
128
-
129
-
130
-
131
-
132
-
133
-
134
-
135
-
136
-
137
-
138
-
139
-
140
-
141
-
142
-
143
-
144
-
145
-
146
-
147
-
148
-
149
-
150
-
151
-
152
-
153
-
154
-
155
-
156
-
157
-
158
-
159
-
160
-
161
-
162
-
163
-
164
-
165
 |
 |

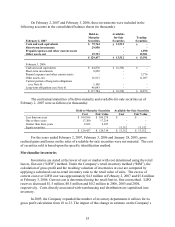
period and a $1.1 million reduction of the original estimate, resulting in a balance of
approximately $3.6 million for inventory owned as of February 2, 2007.
All expenses associated with exit and disposal activities are included in SG&A expenses
with the exception of the below-cost inventory adjustments, which are included in cost of goods
sold in the consolidated statement of income for 2006. As noted above, the Company expects to
incur additional charges in future periods when the related expenses are incurred. The estimated
amount and timing of these future costs and charges are dependent on various factors, including
timing of the execution of the plan, the outcome of negotiations with landlords and/or potential
sublease tenants, and final inventory levels.
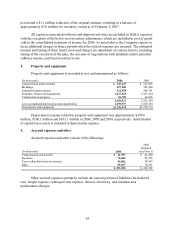
3. Property and equipment
Property and equipment is recorded at cost and summarized as follows:
(In thousands) 2006 2005
Land and land improvements $147,447 $147,039
Buildings 437,368 381,460
Leasehold improvements 212,078 209,701
Furniture, fixtures and equipment 1,617,163 1,437,324
Construction in progress 16,755 46,016
2,430,811 2,221,540
Less accumulated depreciation and amortization 1,193,937 1,029,368
Net property and equipment $1,236,874 $1,192,172
Depreciation expense related to property and equipment was approximately $199.6
million, $186.1 million and $163.1 million in 2006, 2005 and 2004, respectively. Amortization
of capital lease assets is included in depreciation expense.
4. Accrued expenses and other
Accrued expenses and other consist of the following:
(In thousands) 2006
2005
Restated
(see Note 1)
Compensation and benefits $ 41,957 $ 41,460
Insurance 76,062 65,376
Taxes (other than taxes on income) 50,502 58,967
Other 85,037 76,551
$253,558 $242,354
Other accrued expenses primarily include the current portion of liabilities for deferred
rent, freight expense, contingent rent expense, interest, electricity, and common area
maintenance charges.
65