Dollar General 2006 Annual Report Download - page 10
Download and view the complete annual report
Please find page 10 of the 2006 Dollar General annual report below. You can navigate through the pages in the report by either clicking on the pages listed below, or by using the keyword search tool below to find specific information within the annual report.-
 1
1 -
 2
2 -
 3
3 -
 4
4 -
 5
5 -
 6
6 -
 7
7 -
 8
8 -
 9
9 -
 10
10 -
 11
11 -
 12
12 -
 13
13 -
 14
14 -
 15
15 -
 16
16 -
 17
17 -
 18
18 -
 19
19 -
 20
20 -
 21
21 -
22
-
23
-
24
-
25
-
26
-
27
-
28
-
29
-
30
-
31
-
32
-
33
-
34
-
35
-
36
-
37
-
38
-
39
-
40
-
41
-
42
-
43
-
44
-
45
-
46
-
47
-
48
-
49
-
50
-
51
-
52
-
53
-
54
-
55
-
56
-
57
-
58
-
59
-
60
-
61
-
62
-
63
-
64
-
65
-
66
-
67
-
68
-
69
-
70
-
71
-
72
-
73
-
74
-
75
-
76
-
77
-
78
-
79
-
80
-
81
-
82
-
83
-
84
-
85
-
86
-
87
-
88
-
89
-
90
-
91
-
92
-
93
-
94
-
95
-
96
-
97
-
98
-
99
-
100
-
101
-
102
-
103
-
104
-
105
-
106
-
107
-
108
-
109
-
110
-
111
-
112
-
113
-
114
-
115
-
116
-
117
-
118
-
119
-
120
-
121
-
122
-
123
-
124
-
125
-
126
-
127
-
128
-
129
-
130
-
131
-
132
-
133
-
134
-
135
-
136
-
137
-
138
-
139
-
140
-
141
-
142
-
143
-
144
-
145
-
146
-
147
-
148
-
149
-
150
-
151
-
152
-
153
-
154
-
155
-
156
-
157
-
158
-
159
-
160
-
161
-
162
-
163
-
164
-
165
 |
 |

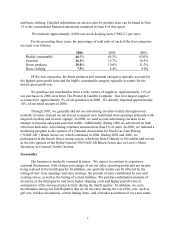
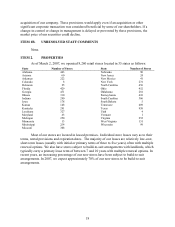
The following table reflects the seasonality of net sales, operating profit, and net income
(loss) by quarter. All of the quarters reflected below are comprised of 13 weeks with the
exception of the fourth quarter of the year ended February 3, 2006, which was comprised of 14
weeks.
1st
Quarter
2nd
Quarter
3rd
Quarter
4th
Quarter
Year Ended February 2, 2007
Net sales 23.5% 24.5% 24.1 % 27.9%
Operating profit (a) 32.7% 32.5% 1.3 % 33.5%
Net income (loss) (a) 34.5% 33.0% (3.8)% 36.3%
Year Ended February 3, 2006
Net sales 23.0% 24.1% 24.0 % 28.9%
Operating profit 19.0% 21.5% 18.1 % 41.3%
Net income 18.5% 21.6% 18.4 % 41.5%
Year Ended January 28, 2005
Net sales 22.8% 24.0% 24.5 % 28.7%
Operating profit 20.6% 19.4% 20.5 % 39.6%
Net income 19.7% 20.7% 20.7 % 38.9%
(a) Results for the 3rd and 4th quarters of 2006 reflect the impact of Recent Strategic Initiatives as discussed
above and in further detail below under “Management’ s Discussion and Analysis of Financial Condition
and Results of Operations”.
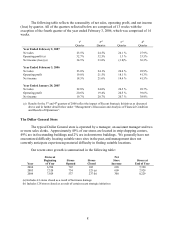
The Dollar General Store
The typical Dollar General store is operated by a manager, an assistant manager and two
or more sales clerks. Approximately 49% of our stores are located in strip shopping centers,
49% are in freestanding buildings and 2% are in downtown buildings. We generally have not
encountered difficulty locating suitable store sites in the past, and management does not
currently anticipate experiencing material difficulty in finding suitable locations.
Our recent store growth is summarized in the following table:
Year
Stores at
Beginning
of Year
Stores
Opened
Stores
Closed
Net
Store
Increase
Stores at
End of Year
2004 6,700 722 102 620 7,320
2005 7,320 734 125 (a) 609 7,929
2006 7,929 537 237 (b) 300 8,229
(a) Includes 41 stores closed as a result of hurricane damage.
(b) Includes 128 stores closed as a result of certain recent strategic initiatives
8