Dollar General 2006 Annual Report Download - page 57
Download and view the complete annual report
Please find page 57 of the 2006 Dollar General annual report below. You can navigate through the pages in the report by either clicking on the pages listed below, or by using the keyword search tool below to find specific information within the annual report.-
 1
1 -
2
-
3
-
4
-
5
-
6
-
7
-
8
-
9
-
10
-
11
-
12
-
13
-
14
-
15
-
16
-
17
-
18
-
19
-
20
-
21
-
22
-
23
-
24
-
25
-
26
-
27
-
28
-
29
-
30
-
31
-
32
-
33
-
34
-
35
-
36
-
37
-
38
-
39
-
40
-
41
-
42
-
43
-
44
-
45
-
46
-
 47
47 -
 48
48 -
 49
49 -
 50
50 -
 51
51 -
 52
52 -
 53
53 -
 54
54 -
 55
55 -
 56
56 -
 57
57 -
 58
58 -
 59
59 -
 60
60 -
 61
61 -
 62
62 -
 63
63 -
 64
64 -
 65
65 -
 66
66 -
 67
67 -
68
-
69
-
70
-
71
-
72
-
73
-
74
-
75
-
76
-
77
-
78
-
79
-
80
-
81
-
82
-
83
-
84
-
85
-
86
-
87
-
88
-
89
-
90
-
91
-
92
-
93
-
94
-
95
-
96
-
97
-
98
-
99
-
100
-
101
-
102
-
103
-
104
-
105
-
106
-
107
-
108
-
109
-
110
-
111
-
112
-
113
-
114
-
115
-
116
-
117
-
118
-
119
-
120
-
121
-
122
-
123
-
124
-
125
-
126
-
127
-
128
-
129
-
130
-
131
-
132
-
133
-
134
-
135
-
136
-
137
-
138
-
139
-
140
-
141
-
142
-
143
-
144
-
145
-
146
-
147
-
148
-
149
-
150
-
151
-
152
-
153
-
154
-
155
-
156
-
157
-
158
-
159
-
160
-
161
-
162
-
163
-
164
-
165
 |
 |

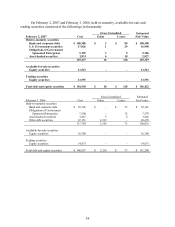
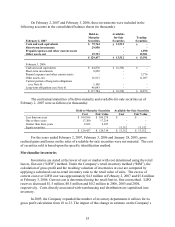
On February 2, 2007 and February 3, 2006, these investments were included in the
following accounts in the consolidated balance sheets (in thousands):
February 2, 2007
Held-to-
Maturity
Securities
Available-
for-Sale
Securities
Trading
Securities
Cash and cash equivalents $ 79,764 $
13,512 $ -
Short-term investments 29,950 - -
Prepaid expenses and other current assets - - 1,090
Other assets, net 19,723 - 12,501
$129,437 $
13,512 $
13,591
February 3, 2006
Cash and cash equivalents $ 44,870 $
16,300 $ -
Short-term investments 8,850 - -
Prepaid expenses and other current assets - - 3,776
Other assets, net 16,913 - 11,097
Current portion of long-term obligations
(see Note 6) 1,108 - -
Long-term obligations (see Note 6) 46,043 - -
$117,784 $
16,300 $
14,873
The contractual maturities of held-to-maturity and available-for-sale securities as of
February 2, 2007 were as follows (in thousands):
Held-to-Maturity Securities Available-for-Sale Securities
Cost Fair Value Cost Fair Value
Less than one year $ 109,304 $ 109,278 $ - $ -
One to three years 17,300 17,214 - -
Greater than three years 2,833 2,827 - -
Equity securities - - 13,512 13,512
$ 129,437 $ 129,319 $ 13,512 $ 13,512
For the years ended February 2, 2007, February 3, 2006 and January 28, 2005, gross
realized gains and losses on the sales of available-for-sale securities were not material. The cost
of securities sold is based upon the specific identification method.
Merchandise inventories
Inventories are stated at the lower of cost or market with cost determined using the retail
last-in, first-out (“LIFO”) method. Under the Company’ s retail inventory method (“RIM”), the
calculation of gross profit and the resulting valuation of inventories at cost are computed by
applying a calculated cost-to-retail inventory ratio to the retail value of sales. The excess of
current cost over LIFO cost was approximately $4.3 million at February 2, 2007 and $5.8 million
at February 3, 2006. Current cost is determined using the retail first-in, first-out method. LIFO
reserves decreased $1.5 million, $0.5 million and $0.2 million in 2006, 2005 and 2004,
respectively. Costs directly associated with warehousing and distribution are capitalized into
inventory.
In 2005, the Company expanded the number of inventory departments it utilizes for its
gross profit calculation from 10 to 23. The impact of this change in estimate on the Company’ s
55